Bemærk
Adgang til denne side kræver godkendelse. Du kan prøve at logge på eller ændre mapper.
Adgang til denne side kræver godkendelse. Du kan prøve at ændre mapper.
This article describes common issues with developing Azure Stream Analytics queries, how to troubleshoot query issues, and how to correct the issues. Many troubleshooting steps require you to enable resource logs for your Stream Analytics job. If you don't have resource logs enabled, see Troubleshoot Azure Stream Analytics by using resource logs.
Query isn't producing expected output
Examine errors by testing locally:
- In the Azure portal, on the Query tab, select Test. Use the downloaded sample data to test the query. Examine any errors and attempt to correct them.
- You can also test your query locally by using Azure Stream Analytics tools for Visual Studio or Visual Studio Code.
Debug queries step by step locally using job diagram in Azure Stream Analytics tools for Visual Studio Code. The job diagram shows how data flows from input sources, for example, Azure Event Hubs and Azure IoT Hub, through multiple query steps and finally to output sinks. The script maps each query step to a temporary result set that you define by using the WITH statement. View the data and metrics in each intermediate result set to find the source of the issue.

If you use Timestamp By, verify that the events have timestamps greater than the job start time.
Eliminate common pitfalls, such as:
- A WHERE clause in the query filtered out all events, so the query produces no output.
- A CAST function fails, causing the job to fail. To avoid type cast failures, use TRY_CAST instead.
- When you use window functions, wait for the entire window duration to see an output from the query.
- The timestamp for events precedes the job start time, so the job drops the events.
- JOIN conditions don't match. If there are no matches, the query produces no output.
Ensure that you configure event ordering policies as expected. Go to Settings and select Event Ordering. The Test button doesn't apply the policy when you test the query. This result is one difference between testing in-browser and running the job in production.
Debug by using activity and resource logs:
- Use Activity Logs, and filter to identify and debug errors.
- Use job resource logs to identify and debug errors.
Debug queries progressively
In real-time data processing, it helps to know what the data looks like in the middle of the query. To view the intermediate data, use the job diagram in Visual Studio. If you don't have Visual Studio, you can take extra steps to output intermediate data.
Because Azure Stream Analytics can read inputs or steps of a job multiple times, you can write extra SELECT INTO statements. Doing so outputs intermediate data into storage and lets you check the correctness of the data, just as watch variables do when you debug a program.
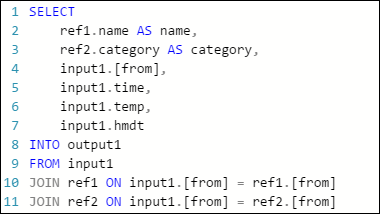
The following example query in an Azure Stream Analytics job has one stream input, two reference data inputs, and an output to Azure Table Storage. The query joins data from the event hub and two reference blobs to get the name and category information:
The job is running, but it produces no events in the output. On the Monitoring tile, shown here, you can see that the input is producing data, but you don't know which step of the JOIN dropped all the events.

In this situation, you can add a few extra SELECT INTO statements to "log" the intermediate JOIN results and the data that's read from the input.
In this example, we added two new "temporary outputs." They can be any sink you like. Here we use Azure Storage as an example:

You can then rewrite the query like this:
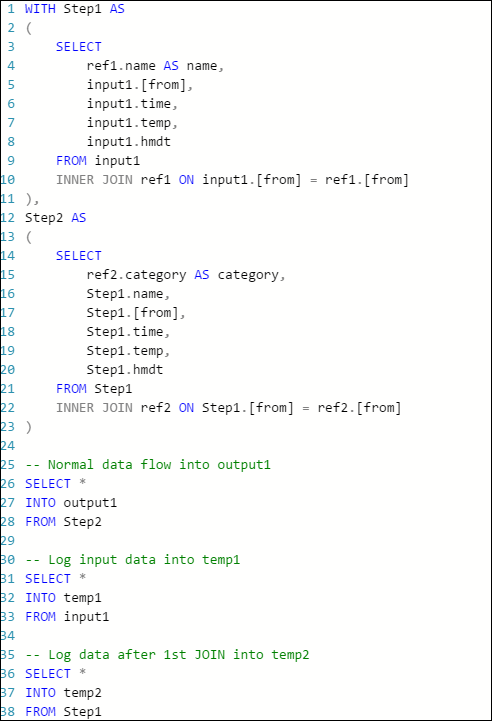
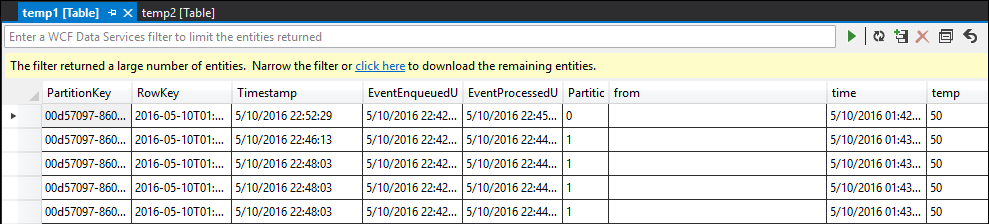
Now start the job again, and let it run for a few minutes. Then query temp1 and temp2 with Visual Studio Cloud Explorer to produce the following tables:
temp1 table
temp2 table
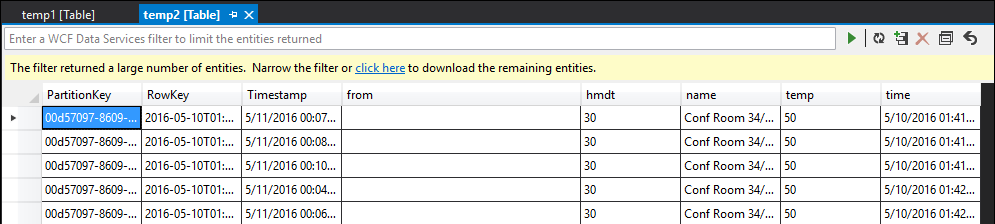
As you can see, temp1 and temp2 both have data, and the name column is populated correctly in temp2. However, because output still has no data, something is wrong:

By sampling the data, you can be almost certain that the issue is with the second JOIN. You can download the reference data from the blob and take a look:
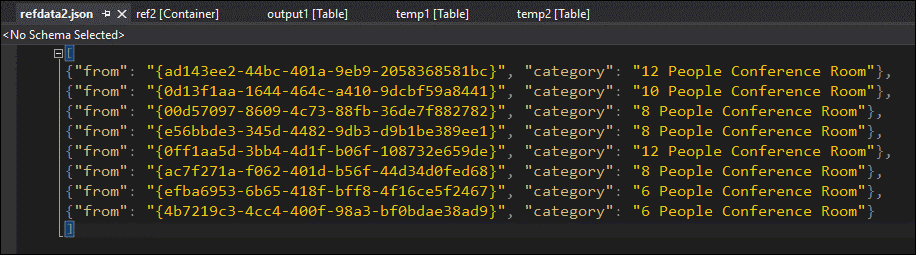
As you can see, the format of the GUID in this reference data is different from the format of the [from] column in temp2. That's why the data didn't arrive in output1 as expected.
Fix the data format, upload it to the reference blob, and try again:
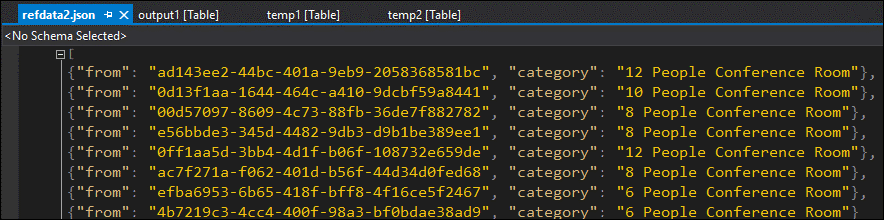
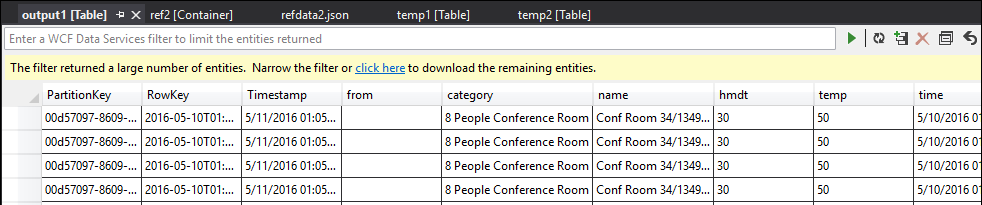
This time, the data in the output is formatted and populated as expected.
Resource utilization is high
Ensure you take advantage of parallelization in Azure Stream Analytics. Learn to scale with query parallelization of Stream Analytics jobs by configuring input partitions and tuning the analytics query definition.
If resource utilization is consistently over 80%, the watermark delay is rising, and the number of backlogged events is rising, consider increasing streaming units. High utilization indicates that the job is using close to the maximum allocated resources.
Get help
For further assistance, try our Microsoft Q&A question page for Azure Stream Analytics.