Note
Access to this page requires authorization. You can try signing in or changing directories.
Access to this page requires authorization. You can try changing directories.
This article shows you how to view the telemetry emitted by your feature flags in Azure App Configuration. You learn how to view feature flag evaluation events in Application Insights, verify variant assignments and their allocation percentages, confirm that overrides and flag state changes produce the expected behavior, and run a Kusto query in Application Insights to compare how different variants perform against custom application events.
Prerequisites
- The feature flag with telemetry enabled from Enable telemetry for feature flags.
View feature flag events in Azure App Configuration
Go to the Application Insights in the App Configuration portal. You see a graph that shows all events from your application. This graph gives you an overview of activity patterns.
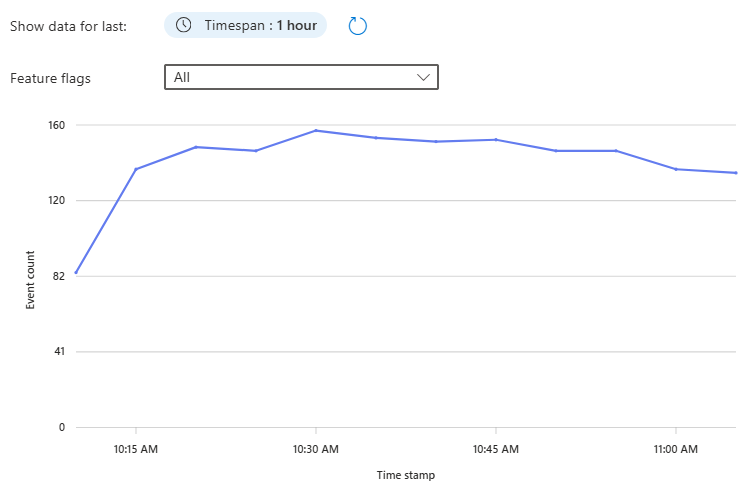
Use the time range selector to focus on specific periods so you can identify trends or investigate particular timeframes.
Filter by feature flag
- Select the dropdown menu above the event graph.
- Under Feature flags with events, select your feature flag.
- The graph now shows only events related to the feature flag's evaluations.

To access more detailed telemetry, select View details to open the telemetry tab.

Note
You can also access this tab by going to the Feature manager and selecting View events in the telemetry column for the feature flag.

Verify variant assignments
In the telemetry tab, you can view:
- Total events: Total number of evaluation events your application emits.
- Unique users: Number of distinct users who are targeted and for whom the application emits events.
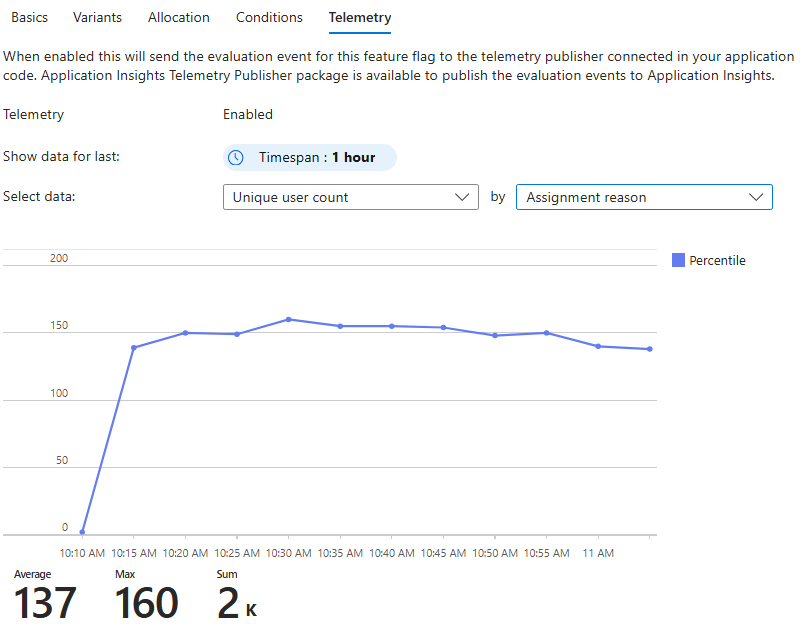
To show the distribution of users and the number of evaluations across the Simple, Long, and None variants, group the metrics by variant. This grouping helps you see whether the configured allocations work as expected and whether the application serves all expected variants to users.

In this example, the number of users assigned the None variant is almost twice that of the Simple and Long variants, given the configured 50-25-25 percentile split between None, Simple, and Long variants.
Confirm overrides and behavior based on flag state
Users might receive a variant for different reasons. Ensure that your variant assignments are not only in the right proportion but also for the right reason. You can group metrics by assignment reason. In this example, the only assignment reason is Percentile allocations.
Disable the feature flag by going to the feature manager and toggling the feature flag Enable switch.
In the telemetry column, click View events to go to telemetry tab in read-only mode.
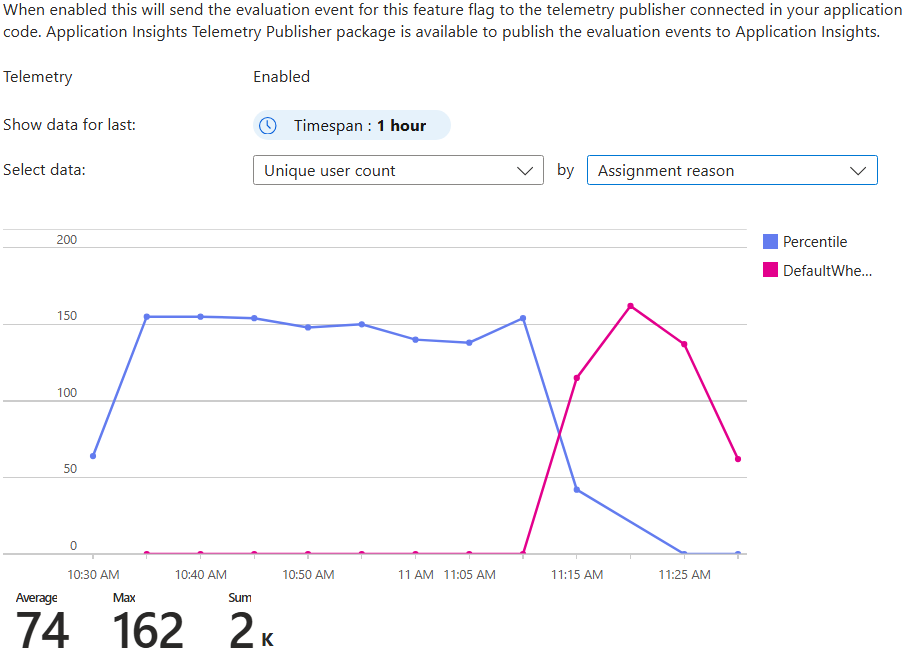
View Unique user count by Variant. You should see that all assignments for Long and Simple go to zero. Only the None variant, which is the default in this case, is assigned to users.

Switch to Unique user count by assignment reason. Confirm from the graph that the Percentile allocations fall to zero and DefaultWhenDisabled is the only reason for which users are being assigned variants.
Other possible reasons include DefaultWhenEnabled, Group, or User if configured.
View telemetry in Application Insights
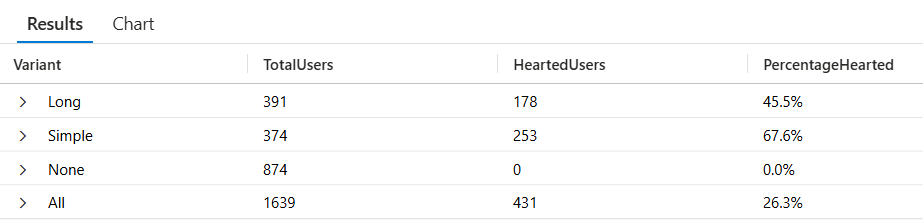
After you confirm the feature flag allocations are working as expected, dive deeper into the telemetry events to see how different variants perform based on the likes that users send.
Open your Application Insights resource in the Azure portal and select Logs under Monitoring. In the query window, run the following query to see the telemetry events:
// Step 1: Get distinct users and their Variant from FeatureEvaluation (Replace <AppConfigurationEndpoint> with your store's endpoint)
let evaluated_users =
    customEvents
    | where name == "FeatureEvaluation"
    | where tostring(customDimensions.FeatureFlagReference) == "https://<AppConfigurationEndpoint>/kv/.appconfig.featureflag/Greeting"
    | extend TargetingId = tostring(customDimensions.TargetingId),
            Variant = tostring(customDimensions.Variant)
    | summarize Variant = any(Variant) by TargetingId;

// Step 2: Get distinct users who emitted a "Like"
let liked_users =
    customEvents
    | where name == "Liked"
    | extend TargetingId = tostring(customDimensions.TargetingId)
    | summarize by TargetingId;

// Step 3: Join them to get only the evaluated users who also liked
let hearted_users =
    evaluated_users
    | join kind=inner (liked_users) on TargetingId
    | summarize HeartedUsers = dcount(TargetingId) by Variant;

// Step 4: Total evaluated users per variant
let total_users =
    evaluated_users
    | summarize TotalUsers = dcount(TargetingId) by Variant;

// Step 5: Combine results
let combined_data =
    total_users
    | join kind=leftouter (hearted_users) on Variant
    | extend HeartedUsers = coalesce(HeartedUsers, 0)
    | extend PercentageHearted = strcat(round(HeartedUsers * 100.0 / TotalUsers, 1), "%")
    | project Variant, TotalUsers, HeartedUsers, PercentageHearted;

// Step 6: Add total row
let total_sum =
    combined_data
    | summarize Variant="All", TotalUsers = sum(TotalUsers), HeartedUsers = sum(HeartedUsers);

// Step 7: Output
combined_data
| union (total_sum)
You see one FeatureEvaluation event for each time the quote page loads and one Liked event for each time the like button is clicked. The FeatureEvaluation events have a custom property called FeatureName with the name of the feature flag that was evaluated. Both events have a custom property called TargetingId with the name of the user that liked the quote.
In this example, even though the number of users getting the Long variant versus Simple was roughly the same, the Simple variant performs better by a margin of 22%.