Note
Access to this page requires authorization. You can try signing in or changing directories.
Access to this page requires authorization. You can try changing directories.
This article describes the monitoring data available for Azure Data Manager for Energy and how to view and analyze it.
When you have critical applications and business processes that rely on Azure resources, you need to monitor your Azure Data Manager for Energy instance for usage and health. You can view these platform metrics in the Azure portal directly from your resource, or you can use Azure Monitor.
- For more information on Azure Monitor, see the Azure Monitor overview.
- For more information on how to monitor Azure resources in general, see Monitor Azure resources with Azure Monitor.
Resource types
Azure uses resource types and resource IDs to identify resources within a subscription. Each resource ID includes the resource type. For Azure Data Manager for Energy, the resource type is Microsoft.OpenEnergyPlatform/energyServices.
Azure Monitor organizes monitoring data, including metrics and logs, by resource type. In Azure Monitor, resource types also serve as namespaces. The available metrics and logs vary by resource type.
For more information about the resource types for Azure Data Manager for Energy, see Azure Data Manager for Energy monitoring data reference.
View metrics from the Azure Data Manager for Energy resource
You can access metrics directly from your Azure Data Manager for Energy resource in the Azure portal.
Sign in to the Azure portal.
Go to your Azure Data Manager for Energy resource.
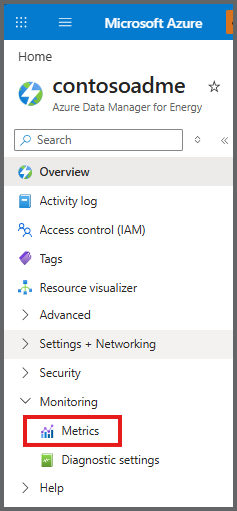
In the left menu under Monitoring, select Metrics.
Select Add metric.
Choose the metric you want to view from the Metric dropdown (for example, Total Http Requests or Data Volume).
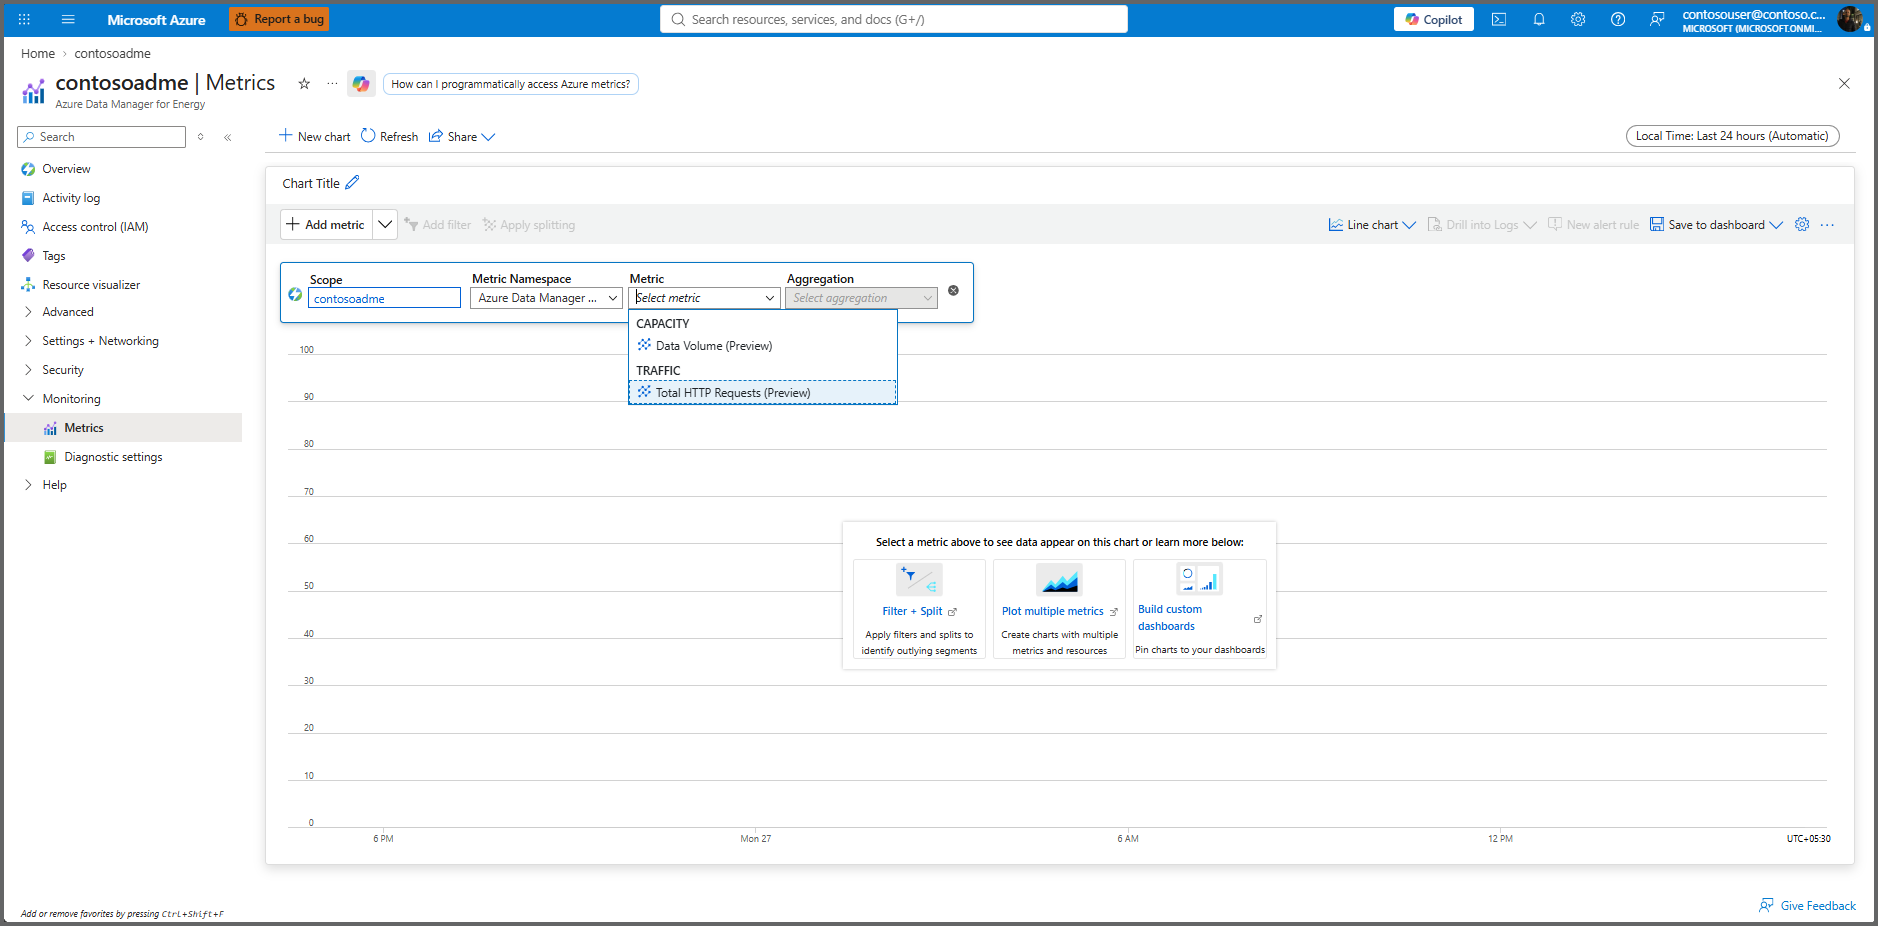
Select the desired Aggregation (for example, Sum).
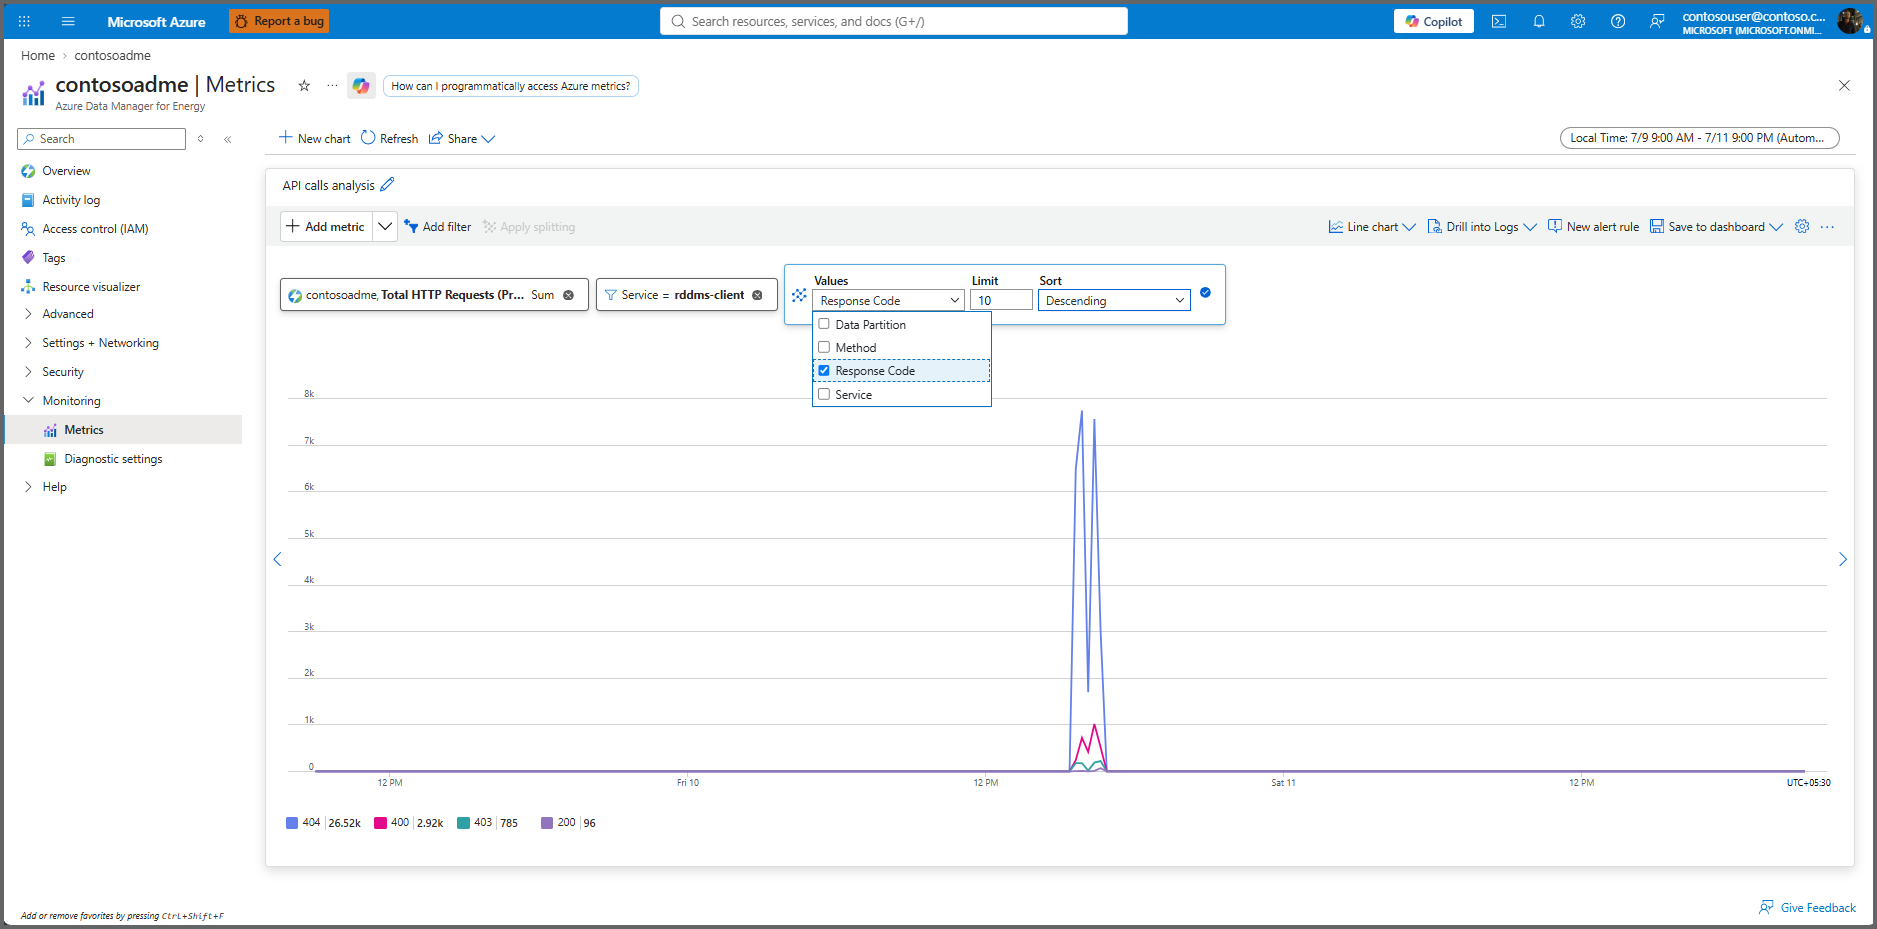
Optionally, use Add filter to filter by a specific dimension such as Service or Data Partition.

Optionally, use Apply splitting to split the chart by a dimension.

View metrics from Azure Monitor
You can also access metrics through the centralized Azure Monitor experience, which you can use to view metrics across multiple resources.
Sign in to the Azure portal.
From the portal menu or search bar, go to Azure Monitor.
Select Metrics from the left menu.

In the Scope picker, select your Azure Data Manager for Energy resource.

Choose the metric, aggregation, and filters you want, as described in the previous section.

For more information about how to use Metrics Explorer, see Analyze metrics with Azure Monitor metrics explorer.
Metrics data availability and retention
Platform metrics for Azure Data Manager for Energy are available from the date you enable the feature on your instance. Metrics data is retained for 93 days. While you can only query up to 30 days of data on a single chart, you can pan the chart to view the full retention window.
For more information on metrics retention, see Azure Monitor Metrics overview - Retention of metrics.