Note
Access to this page requires authorization. You can try signing in or changing directories.
Access to this page requires authorization. You can try changing directories.
Important
Some information in this article relates to a prereleased product, which may be substantially modified before it's commercially released. Microsoft makes no warranties expressed or implied, with respect to the information provided here
The Microsoft Defender portal helps security teams investigate and respond to container threats in near real-time. It combines cloud-native response actions, investigation logs, and attack path analysis in one place.
Organizations use containers and Kubernetes on platforms like Azure Kubernetes Service (AKS), Google Kubernetes Engine (GKE), and Amazon Elastic Kubernetes Service (EKS). As adoption grows, the attack surface expands. Threat actors can target containers for malicious purposes.
Security operations center (SOC) analysts can track container threats with near real-time alerts. They can respond by isolating or terminating container pods in a single click.
Analysts can also hunt for related activities in the incident graph to find the full scope of an attack. Attack paths in the incident graph help security teams spot vulnerable paths and prevent breaches. Threat analytics reports cover active container threats and provide steps for response and prevention.
Prerequisites
Users on AKS, EKS, and GKE platforms need the following licenses to use cloud response actions, investigation logs, and attack paths in the Microsoft Defender portal:
| Required license | Actions |
|---|---|
| Microsoft Defender for Containers | View container-related alerts View container-related data for investigation in advanced hunting Isolate pod Terminate pod Restrict pod access |
| Microsoft Defender for Cloud Security Posture Management | View attack paths in the incident graph |
| Microsoft Security Copilot | View and apply guided responses to investigate and remediate container threats |
Cloud response actions in the Microsoft Defender portal require the following Microsoft Defender for Containers components:
- Defender sensor
- Kubernetes API access
For more information, see Configure Microsoft Defender for Containers components.
Network policy requirement
The isolate pod and restrict pod access response actions support Kubernetes cluster version 1.27 and later. The following network plugins are also required:
| Network plugin | Minimum version required |
|---|---|
| Azure-NPM | 1.5.34 |
| Calico | 3.24.1 |
| Cilium | 1.13.1 |
| AWS-node | 1.15.1 |
The isolate pod and restrict pod access response actions require a network policy enforcer for your Kubernetes cluster. The following documentation provides specific steps on how to install and check network policies depending on your platform:
- Azure Kubernetes Service: Secure traffic between pods by using network policies in AKS
- Google Kubernetes Engine: Control communication between Pods and Services using network policies
- Amazon Kubernetes Engine: Limit pod traffic with Kubernetes network policies
To verify your network plugins are supported, access your platform's Cloud Shell and run the network plugin check command. For detailed steps, see Troubleshoot issues later in this article.
The terminate pod response action functions regardless of the presence of a network policy.
Required permissions
To use response actions, you need these Microsoft Defender for Cloud permissions in Microsoft Defender unified RBAC:
| Permission name | Level |
|---|---|
| Alerts | Manage |
| Response | Manage |
For more information on these permissions, see Permissions in Microsoft Defender unified role-based access control (RBAC).
Investigate container threats
To investigate container threats in the Microsoft Defender portal:
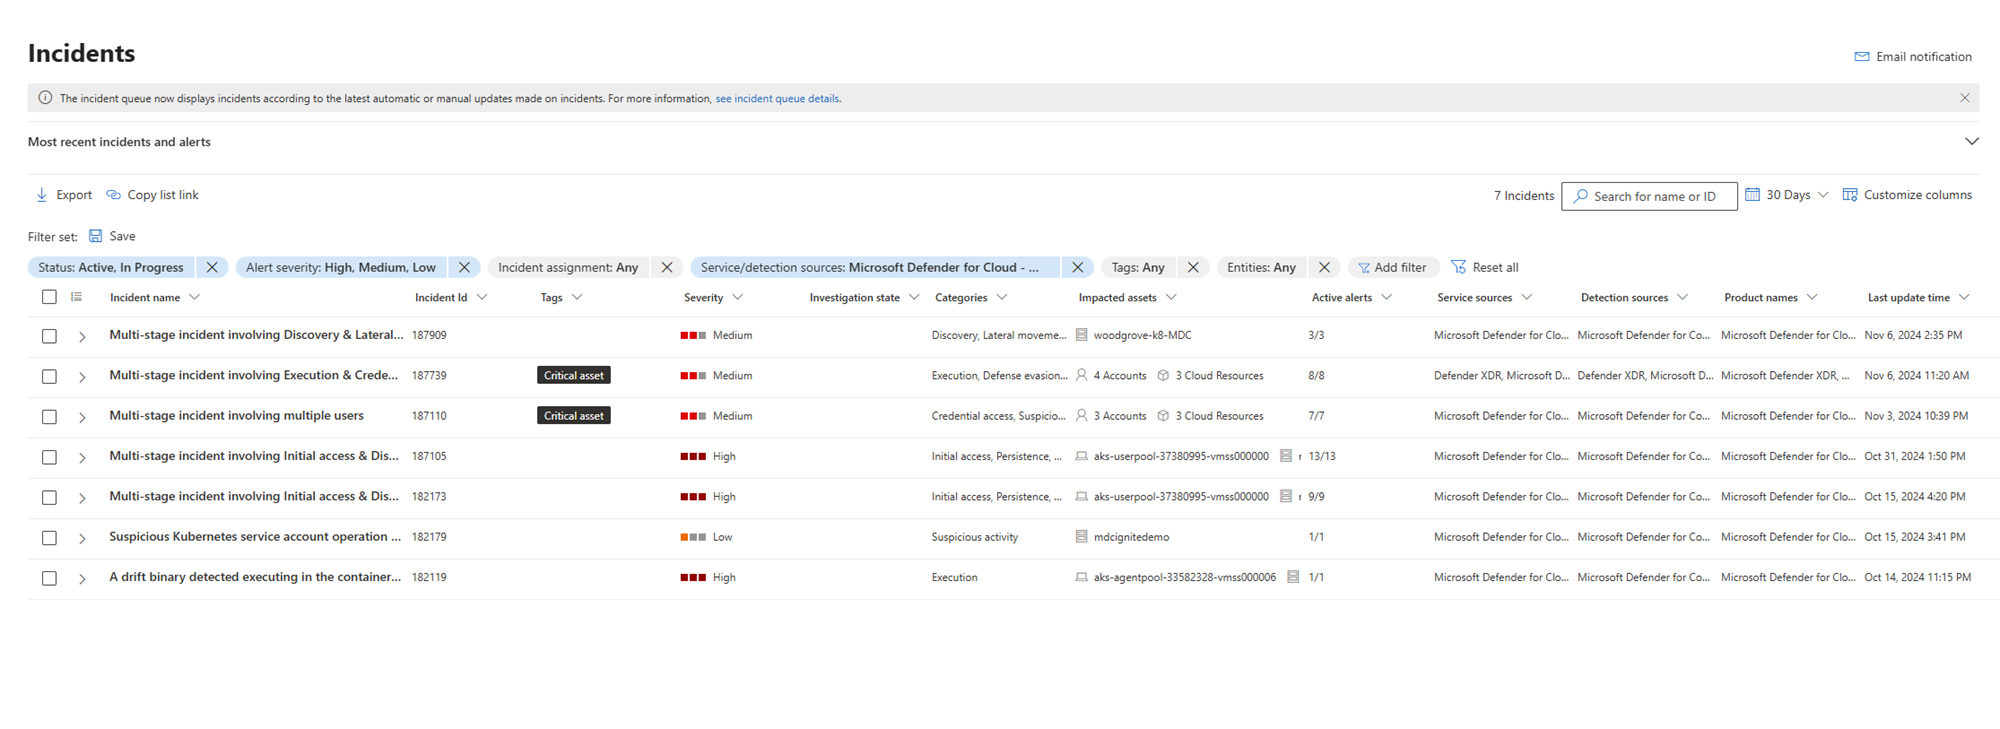
- Select Investigation & response > Incidents and alerts in the left-hand navigation menu to open the incident or alert queues.
- In the queue, select Filter and choose Microsoft Defender for Cloud > Microsoft Defender for Containers under Service source.

- In the incident graph, select the pod/service/cluster entity you need to investigate. Select Kubernetes service details, Kubernetes pod details, Kubernetes cluster details, or Container registry details to view relevant information about the service, pod, or registry.
Threat analytics reports help analysts learn about active threat actors targeting containers, new attack methods, and common container threats. These reports use threat intelligence from Microsoft security researchers.
To access these reports, go to Threat intelligence > Threat analytics. You can also open a report from the incident page. Select View threat analytics report under Related threats on the incident side pane.

Each report includes steps for mitigation, recovery, and prevention. SOC teams can use this information to defend their environment from container attacks. Here's an example of a report about a container attack.

Respond to container threats
You can isolate, restrict access to, or terminate a pod once you determine that a pod is compromised or malicious. In the incident graph, select the pod then go to Actions to view the available response actions. You can also find these response actions on the entity side pane.

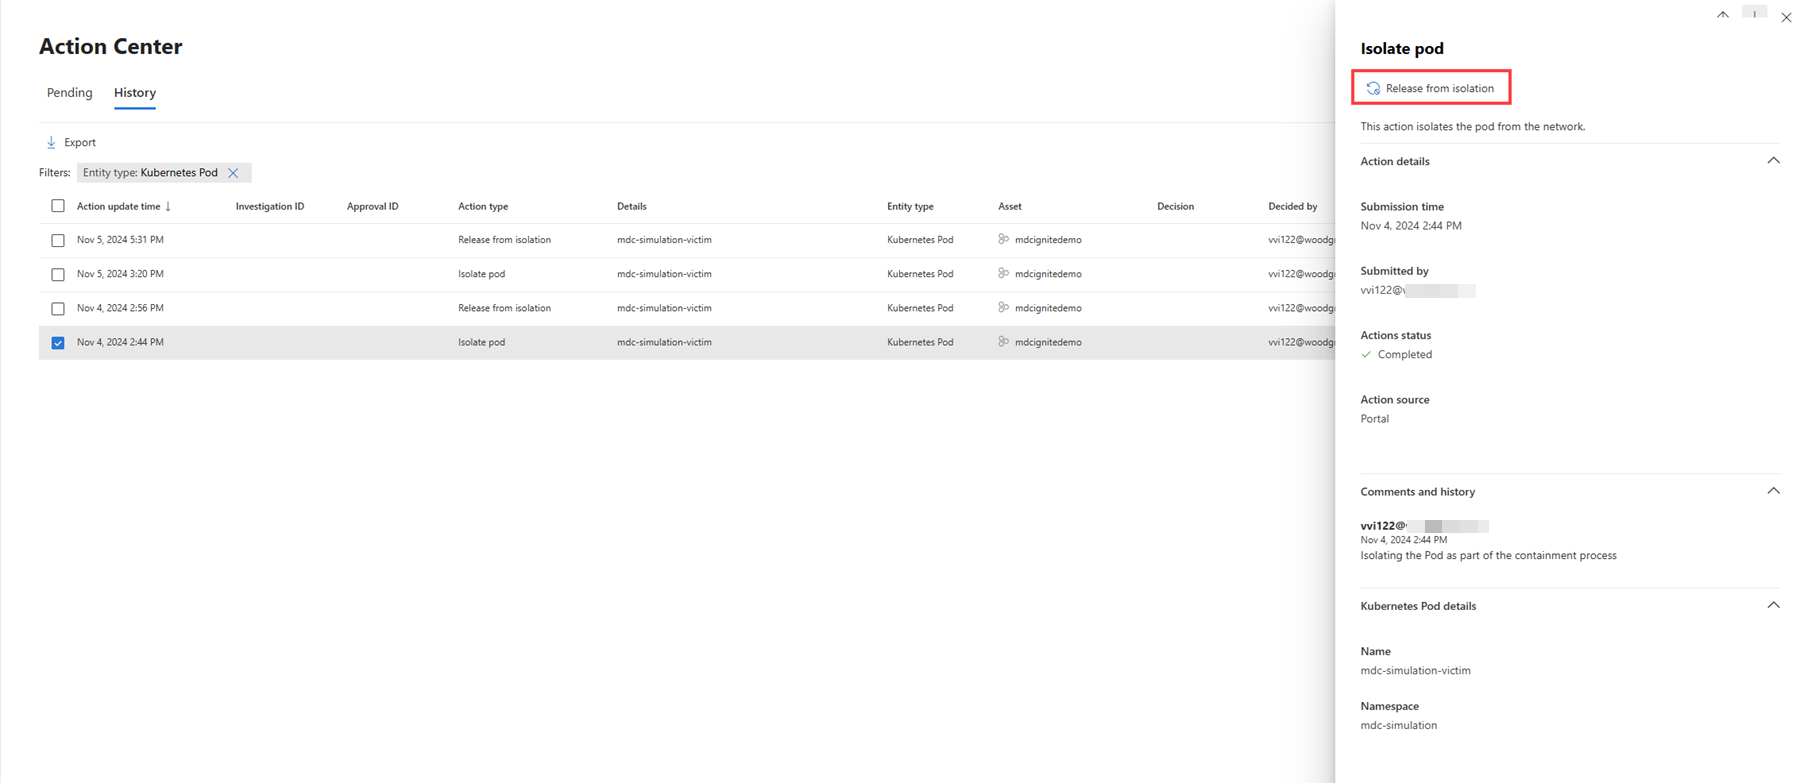
You can release a pod from isolation with the release from isolation action once your investigation is complete. This option appears on the side pane for isolated pods.
You can view all response actions in the Action center. Select a response action to see details such as the affected entity, the time of the action, and any comments. For isolated pods, the release from isolation action is also available in the Action center details pane.
Hunt for container-related activities
Use the Go hunt action in the incident graph to find the full scope of a container attack. This action shows all process events and activities linked to the incident.

On the Advanced hunting page, search for container activities using the CloudProcessEvents and CloudAuditEvents tables.
The CloudProcessEvents table lists process events from multi-cloud platforms like Azure Kubernetes Service, Amazon Elastic Kubernetes Service, and Google Kubernetes Engine.
The CloudAuditEvents table lists cloud audit events from platforms that Microsoft Defender for Cloud protects. It also includes Kubeaudit logs with details about Kubernetes events.
Troubleshoot issues
The following troubleshooting guidance addresses issues that you might encounter when investigating and responding to container threats.
The isolate pod or restrict pod access response action is not available
If the isolate pod or restrict pod access action is grayed out, verify that you have the necessary permissions to perform the selected action. Refer to Required permissions for response actions to validate that you have the correct permissions.
See Permissions in Microsoft Defender unified role-based access control (RBAC) for more information.
The isolate pod or restrict pod access action failed
If the isolate pod or restrict pod access action fails, perform the following checks:
- Check the Kubernetes cluster version. The isolate pod and restrict pod access actions support Kubernetes clusters from version 1.27 and later.
- Check that you are using the required network plugins and that it matches the minimum versions supported. To check your plugins, access the Cloud Shell in your platform and run the command to check your network plugins.
- Ensure the target pod is in a valid or active state.
Learn how to access the Cloud Shell and check your network plugins by following these steps based on your platform:
On Microsoft Azure
Sign in to the Azure portal then navigate to your cluster.
Above the Essential information, select Connect button and follow the instructions.
The Cloud Shell opens at the bottom of your browser. In the command line interface, run the following command to check your network plugins:
kubectl get pods --all-namespaces -o json | jq -r '.items[].metadata.labels["k8s-app"]' | uniq | grep -E 'azure-npm|calico-node|cilium|aws-node' | head -n 1
The results should mention any of the specified plugins in the network policy requirement. An empty line means that the supported plugin is not installed.
On Google Cloud Platform
Navigate your cluster in Google Cloud Portal.
Select Connect above the name of the cluster. In the small window that appears, copy the following command and run it in your local terminal.
kubectl get pods --all-namespaces -o json | jq -r '.items[].metadata.labels["k8s-app"]' | uniq | grep -E 'azure-npm|calico-node|cilium|aws-node' | head -n 1
You can also choose Run in Cloud Shell to run a shell session that opens at the bottom of your browser. You can copy the command in the interface to check your network plugins.
The results should mention any of the specified plugins in the network policy requirement. An empty line means that the supported plugin is not installed.
On Amazon Web Services
Navigate to your cluster in AWS Cloud Portal.
Select CloudShell on the top-right corner. A Cloud Shell session opens at the bottom of your browser, which provides a command-line interface to manage your AWS resources.
Connect to your cluster by running the following command:
aws eks --region <cluster region> update-kubeconfig --name <cluster name>**
Note
Ensure that the aws-node is deleted or disabled for the Calico and Cilium plugins.
The terminate pod action failed
You need to confirm that the target pod's state is active or valid. To check if the pod is active, run the following command in the Cloud Shell:
kubectl get pod <pod-name>