Note
Access to this page requires authorization. You can try signing in or changing directories.
Access to this page requires authorization. You can try changing directories.
Applies to: ✅ Power BI mobile apps
When you view a Power BI report on your phone, Power BI checks if the report is optimized for phones. If it is, Power BI automatically opens the report in the optimized view.
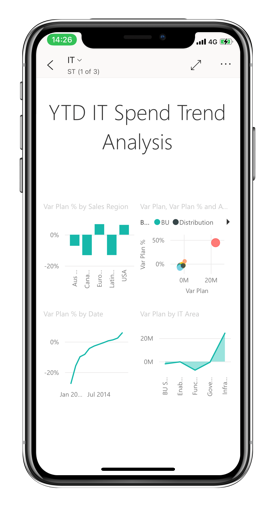
If the report doesn't have an optimized view, in portrait orientation you see a small regular version of the report page. For a closer look, you can either tip the phone to landscape orientation, or, if all you need is a quick look at the numbers, you can quite easily stay in portrait orientation and just use pinch and zoom.
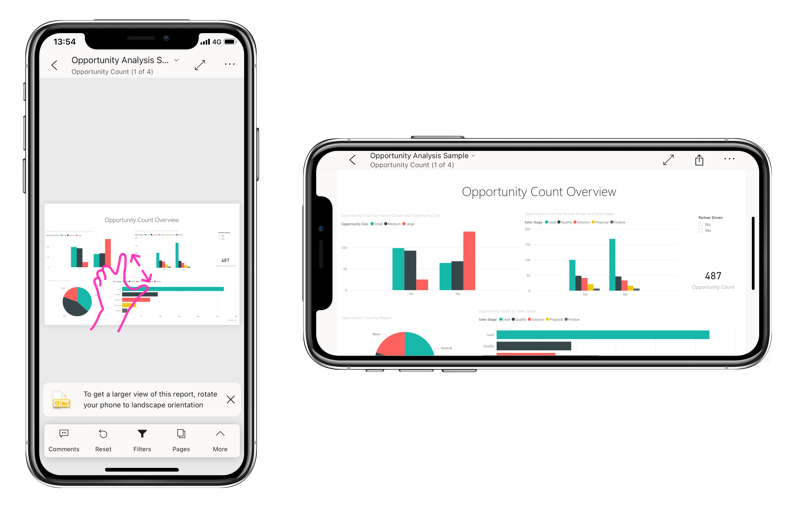
All the other features of Power BI reports still work in phone-optimized reports. Read more about what you can do in:
Filter the report page on a phone
If a report has filters defined, when you view the report on a phone you can use those filters. The report opens on your phone, filtered to the values being filtered in the report on the web.
A filled in filter icon indicates there are active filters on the page. You can change the filters on your phone.
Tap the filter icon in the report footer. The filters appear in panels on the filter pane. Active filters are highlighted.

Tap a filter to open it. You can then change the filter, choose between basic and advanced filtering, and more.

The filters pane supports filter customizations done by the report creator.
Cross-highlight visuals
Cross highlighting visuals in portrait view works the way it does in the Power BI service, and on phones in landscape view: When you select data in one visual, it highlights related data in the other visuals on that page.
Read more about filtering and highlighting in Power BI.
Select visuals
In phone reports when you select a visual, the phone report highlights that visual and focuses on it, neutralizing canvas gestures.
With the visual selected, you can do things like scroll within the visual. To de-select a visual, just touch anywhere outside the visual area.
Open visuals in focus mode
Phone reports also offer a focus mode. You get a bigger view of a single visual and can explore it more easily.
In a phone report, tap the ellipsis (...) in the upper-right corner of a visual > Expand to focus mode.
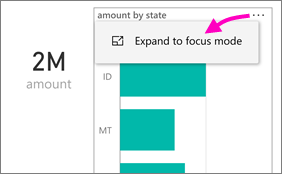
What you do in focus mode carries over to the report canvas and vice versa. For example, if you highlight a value in a visual, then return to the whole report, the report is filtered to the value you highlighted in the visual.
Some actions are only possible in focus mode, due to screen size constraints:
Drill down into the information displayed in a visual. Read more about drilling down and up in a phone report, later in this article.
Sort the values in the visual.
Revert: Clear exploration steps you took on a visual and revert to the definition set when the report was created.
To clear all exploration from a visual, tap the ellipsis (...) > Revert.
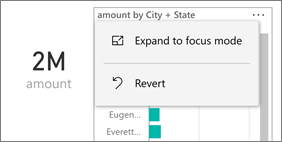
Revert is available at the report level, clearing exploration from all visuals, or at the visual level, clearing exploration from the selected visual.
Drill down in a visual
If you define hierarchy levels in a visual, you can drill down into the detailed information displayed in a visual, then back up. You add drill-down to a visual either in the Power BI service or in Power BI Desktop.
There are a few ways to drill down:
Drill down on a value
Long tap (tap and hold) on a data point in a visual.
The tooltip appears. If a hierarchy exists, the tooltip footer shows drill-down and up arrow.
Tap the down arrow to drill down.

Tap the up arrow to drill up.
Drill to next level
In a report on a phone, tap the ellipsis (...) in the upper-right corner > Expand to focus mode.
In this example, the bars show the values for states.
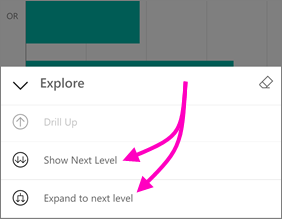
Tap the explore icon
 in the lower left.
Tap Show next level or Expand to next level. Show next level shows the next level down. Expand to next level shows both the current level and the next level down.
Now the bars show the values for cities.
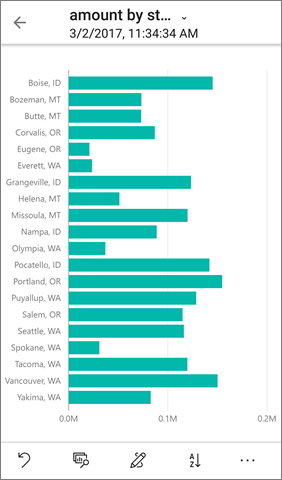
If you tap the arrow in the upper-left corner, you return to the phone report with the values still expanded to the lower level.
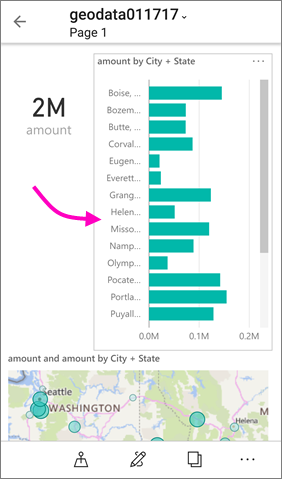
To go back up to the original level, tap the ellipsis (...) again > Revert.
Drill through from a value
Drilling through connects values in one report page with other report pages. When you drill through from a data point to another report page, the data point values filter the drilled through page, or they provide the context for the selected data. Report authors can define drillthrough when they create the report.
Long tap (tap and hold) on a data point in a visual.
The tooltip appears. If the report author defined drillthrough, the tooltip footer shows the drillthrough arrow.
Tap the arrow to drill through.

Choose which report page to drill through.

Use the back arrow on the app header to go back to the page you started from.
Export data to Excel
In the Power BI mobile apps, you can export data from a supported report visual to an Excel file. The exported file is a static copy of the data at the time of export and doesn't keep a live connection to the report.

To export data to Excel:
Open the report in the Power BI mobile app.
Tap the visual you want to export.
Tap the ellipsis (...) to open More options.
Tap Export to Excel.
When the export finishes, you can open the file in Excel, share it, or save it to your device. The file uses the visual's name as its file name. If the visual doesn't have a name, the file is named data.
Power BI selects the export type based on the visual:
- Table and matrix visuals export with the current layout, up to 150,000 data intersections.
- Other supported visual types export as summarized data, up to 150,000 rows.
Any filters you apply to the visual are reflected in the exported data. The exported file keeps the sensitivity label of the visual or report.
Note
Export to Excel from the mobile apps follows the same permissions, report settings, tenant admin settings, sensitivity labels, row-level security (RLS), and export limits as export from the Power BI service. If export is disabled for the report, visual, or user, the Export to Excel option might not appear or might be unavailable.
Ensure a successful export
To get the most out of Export to Excel, keep these tips in mind:
Confirm export is turned on for the visual. The Export to Excel option appears when the report author and your organization's admin enable export for the visual. If you don't see the option, the same visual in the Power BI service shows whether export is available.
Try the export in the Power BI service. Because mobile export uses the same permissions and settings as the service, opening the report in the Power BI service is a great way to confirm the export works and to explore more export options.
Check with the report author. If you'd like export enabled for a visual, reach out to the person who created the report—they can turn on the export option for you.