หมายเหตุ
การเข้าถึงหน้านี้ต้องได้รับการอนุญาต คุณสามารถลอง ลงชื่อเข้าใช้หรือเปลี่ยนไดเรกทอรีได้
การเข้าถึงหน้านี้ต้องได้รับการอนุญาต คุณสามารถลองเปลี่ยนไดเรกทอรีได้
ใช้ Kernel SHAP (SHapley Additive exPlanations) เพื่ออธิบายแบบจําลองการจําแนกประเภทแบบตาราง เคอร์เนล SHAP เป็นวิธีการที่ไม่เชื่อเรื่องโมเดลที่ประเมินการมีส่วนร่วมของแต่ละคุณลักษณะต่อการคาดการณ์ของแบบจําลอง คุณฝึกแบบจําลองการถดถอยโลจิสติกส์ในชุดข้อมูลรายได้สํามะโนประชากรผู้ใหญ่ และจากนั้น ใช้หม้อแปลง SynapseML TabularSHAP เพื่อคํานวณคําอธิบายระดับคุณลักษณะ
ข้อกำหนดเบื้องต้น
รับการสมัครใช้งาน Microsoft Fabric หรือลงทะเบียนเพื่อทดลองใช้งาน Microsoft Fabric ฟรี
ลงชื่อเข้าใช้ Microsoft Fabric
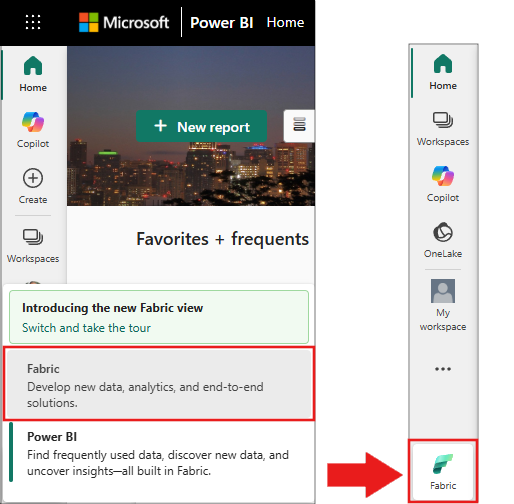
สลับไปยัง Fabric โดยใช้ตัวสลับประสบการณ์ที่ด้านซ้ายล่างของโฮมเพจของคุณ
- สร้างสมุดบันทึกใหม่ในพื้นที่ทํางานของคุณและแนบไปกับเลคเฮาส์ สําหรับข้อมูลเพิ่มเติม ให้ดูที่ การสร้างสมุดบันทึก
SynapseML, PySpark, แพนด้า และพล็อตลีได้รับการติดตั้งไว้ล่วงหน้าในสภาพแวดล้อมโน้ตบุ๊ก Fabric ไม่จําเป็นต้องติดตั้งแพ็คเกจเพิ่มเติม
นําเข้าแพ็คเกจและกําหนด UDF ตัวช่วย
ในสมุดบันทึก Fabric ของคุณ ให้วางโค้ดต่อไปนี้ลงในเซลล์แล้วเรียกใช้ ขั้นตอนนี้จะนําเข้าไลบรารีที่จําเป็นและกําหนดฟังก์ชันที่ผู้ใช้กําหนดเอง (UDF) สองฟังก์ชันสําหรับการแยกองค์ประกอบเวกเตอร์ในภายหลัง
import pyspark
from synapse.ml.explainers import TabularSHAP
from pyspark.ml import Pipeline
from pyspark.ml.classification import LogisticRegression
from pyspark.ml.feature import StringIndexer, OneHotEncoder, VectorAssembler
from pyspark.sql.types import FloatType, ArrayType
from pyspark.sql.functions import col, lit, rand, broadcast, udf
import pandas as pd

vec_access = udf(lambda v, i: float(v[i]), FloatType())
vec2array = udf(lambda vec: vec.toArray().tolist(), ArrayType(FloatType()))
ยืนยัน: เรียกใช้รหัสต่อไปนี้ในเซลล์ใหม่ คุณควรเห็นผลลัพธ์ TabularSHAP imported successfully.
print("TabularSHAP imported successfully")
print(f"PySpark version: {pyspark.__version__}")
โหลดข้อมูลและฝึกโมเดลการจัดประเภท
โหลดชุดข้อมูลรายได้สํามะโนประชากรสําหรับผู้ใหญ่จาก Azure Blob Storage จัดทําดัชนีป้ายชื่อเป้าหมาย และฝึกไปป์ไลน์การถดถอยโลจิสติกส์
df = spark.read.parquet(
    "wasbs://publicwasb@mmlspark.blob.core.windows.net/AdultCensusIncome.parquet"
)

labelIndexer = StringIndexer(
    inputCol="income", outputCol="label", stringOrderType="alphabetAsc"
).fit(df)
print("Label index assignment: " + str(set(zip(labelIndexer.labels, [0, 1]))))

training = labelIndexer.transform(df).cache()

categorical_features = [
    "workclass",
    "education",
    "marital-status",
    "occupation",
    "relationship",
    "race",
    "sex",
    "native-country",
]
categorical_features_idx = [feat + "_idx" for feat in categorical_features]
categorical_features_enc = [feat + "_enc" for feat in categorical_features]
numeric_features = [
    "age",
    "education-num",
    "capital-gain",
    "capital-loss",
    "hours-per-week",
]

strIndexer = StringIndexer(
    inputCols=categorical_features, outputCols=categorical_features_idx
)
onehotEnc = OneHotEncoder(
    inputCols=categorical_features_idx, outputCols=categorical_features_enc
)
vectAssem = VectorAssembler(
    inputCols=categorical_features_enc + numeric_features, outputCol="features"
)
lr = LogisticRegression(featuresCol="features", labelCol="label", weightCol="fnlwgt")
pipeline = Pipeline(stages=[strIndexer, onehotEnc, vectAssem, lr])
model = pipeline.fit(training)
ตรวจสอบ: เรียกใช้เซลล์ต่อไปนี้ คุณควรเห็นจํานวนแถวสําหรับข้อมูลการฝึกอบรมและการยืนยันขั้นตอนไปป์ไลน์
print(f"Training rows: {training.count()}")
print(f"Pipeline stages: {[type(s).__name__ for s in model.stages]}")
assert training.count() > 30000, "Dataset should contain over 30,000 rows"
print("Model trained successfully")

# Expected output:
#Training rows: 32561
#Pipeline stages: ['StringIndexerModel', 'OneHotEncoderModel', #'VectorAssembler', 'LogisticRegressionModel']
#Model trained successfully
เลือกข้อสังเกตที่จะอธิบาย
สุ่มเลือกการสังเกตห้าข้อจากข้อมูลการฝึกอบรมที่ให้คะแนน การสังเกตเหล่านี้เป็นอินสแตนซ์ที่คุณสร้างคําอธิบาย SHAP
explain_instances = (
    model.transform(training).orderBy(rand()).limit(5).repartition(200).cache()
)
display(explain_instances)
ยืนยัน: ยืนยันขนาดตัวอย่าง
count = explain_instances.count()
print(f"Explain instances: {count}")
assert count == 5, f"Expected 5 rows, got {count}"
print("Sample selected successfully")
กําหนดค่าและเรียกใช้ TabularSHAP
สร้าง TabularSHAP คําอธิบายและนําไปใช้กับการสังเกตที่เลือก พารามิเตอร์หลักคือ:
| พารามิเตอร์ | คำอธิบาย |
|---|---|
inputCols |
คอลัมน์คุณลักษณะที่โมเดลใช้สําหรับการคาดคะเน |
outputCol |
ชื่อของคอลัมน์ที่มีค่าเอาต์พุต SHAP |
numSamples |
จํานวนตัวอย่างการรบกวนสําหรับการประมาณค่า Kernel SHAP ค่าที่สูงขึ้นจะแม่นยํากว่า แต่ช้ากว่า |
model |
แบบจําลองไปป์ไลน์ที่ผ่านการฝึกอบรมเพื่ออธิบาย |
targetCol |
คอลัมน์เอาต์พุตแบบจําลองที่จะอธิบาย ในตัวอย่างนี้ คอลัมน์คือ probability. |
targetClasses |
ดัชนีคลาสที่จะอธิบาย
[1] อธิบายความน่าจะเป็นคลาส 1 เท่านั้น ใช้เพื่อ [0, 1] อธิบายทั้งสองคลาส |
backgroundData |
ตัวอย่างข้อมูลการฝึกอบรมที่ใช้เป็นการแจกแจงอ้างอิงสําหรับการรวมคุณลักษณะ |
shap = TabularSHAP(
    inputCols=categorical_features + numeric_features,
    outputCol="shapValues",
    numSamples=5000,
    model=model,
    targetCol="probability",
    targetClasses=[1],
    backgroundData=broadcast(training.orderBy(rand()).limit(100).cache()),
)

shap_df = shap.transform(explain_instances)
Note
ขั้นตอนนี้อาจใช้เวลาหลายนาทีขึ้นอยู่กับ numSamples ขนาดคลัสเตอร์ ด้วย numSamples=5000 และการสังเกตการณ์ห้าครั้ง คาดว่าจะใช้เวลา 3-10 นาทีสําหรับคลัสเตอร์ Fabric Spark เริ่มต้น
ตรวจสอบ: ตรวจสอบว่ามีคอลัมน์เอาต์พุต SHAP อยู่
assert "shapValues" in shap_df.columns, "shapValues column missing"
print(f"SHAP output columns: {shap_df.columns}")
print("TabularSHAP transform completed")
แยกค่า SHAP
แยกความน่าจะเป็นคลาส 1 และค่า SHAP จากผลลัพธ์ DataFrame สําหรับการสังเกตแต่ละครั้ง เวกเตอร์ค่า SHAP จะเริ่มต้นด้วยค่าฐาน (เอาต์พุตเฉลี่ยของชุดข้อมูลพื้นหลัง) ตามด้วยหนึ่งค่าต่อคุณลักษณะ
shaps = (
    shap_df.withColumn("probability", vec_access(col("probability"), lit(1)))
    .withColumn("shapValues", vec2array(col("shapValues").getItem(0)))
    .select(
        ["shapValues", "probability", "label"] + categorical_features + numeric_features
    )
)

shaps_local = shaps.toPandas()
shaps_local.sort_values("probability", ascending=False, inplace=True, ignore_index=True)
pd.set_option("display.max_colwidth", None)
display(shaps_local)
ยืนยัน: ยืนยันโครงสร้าง DataFrame ของแพนด้า
expected_cols = len(categorical_features) + len(numeric_features) + 3
print(f"DataFrame shape: {shaps_local.shape}")
print(f"Expected columns: {expected_cols}, Actual: {shaps_local.shape[1]}")
assert shaps_local.shape == (5, expected_cols), f"Unexpected shape: {shaps_local.shape}"
print("SHAP values extracted successfully")
แสดงภาพค่า SHAP
สร้างแผนภูมิแท่งสําหรับการสังเกตแต่ละครั้งที่แสดงให้เห็นว่าคุณลักษณะแต่ละอย่างมีส่วนช่วยต่อความน่าจะเป็นที่คาดการณ์ไว้อย่างไร
from plotly.subplots import make_subplots
import plotly.graph_objects as go

features = categorical_features + numeric_features
features_with_base = ["Base"] + features

rows = shaps_local.shape[0]

fig = make_subplots(
    rows=rows,
    cols=1,
    subplot_titles="Probability: "
    + shaps_local["probability"].apply("{:.2%}".format)
    + "; Label: "
    + shaps_local["label"].astype(str),
)

for index, row in shaps_local.iterrows():
    feature_values = [0] + [row[feature] for feature in features]
    shap_values = row["shapValues"]
    list_of_tuples = list(zip(features_with_base, feature_values, shap_values))
    shap_pdf = pd.DataFrame(list_of_tuples, columns=["name", "value", "shap"])
    fig.add_trace(
        go.Bar(
            x=shap_pdf["name"],
            y=shap_pdf["shap"],
            hovertext="value: " + shap_pdf["value"].astype(str),
        ),
        row=index + 1,
        col=1,
    )

fig.update_yaxes(range=[-1, 1], fixedrange=True, zerolinecolor="black")
fig.update_xaxes(type="category", tickangle=45, fixedrange=True)
fig.update_layout(height=400 * rows, title_text="SHAP explanations")
fig.show()
ยืนยัน: ยืนยันว่าวัตถุพล็อตถูกสร้างขึ้น
print(f"Figure traces: {len(fig.data)}")
print(f"Figure height: {fig.layout.height}px")
assert len(fig.data) == 5, f"Expected 5 traces, got {len(fig.data)}"
print("Visualization created successfully")
ตีความผลลัพธ์
แต่ละพล็อตย่อยแสดงถึงการสังเกตหนึ่งครั้ง แถบแสดง:
- ฐาน: เอาต์พุตแบบจําลองเฉลี่ยในชุดข้อมูลเบื้องหลัง (ความน่าจะเป็นพื้นฐาน)
- ค่า SHAP ที่เป็นบวก: คุณสมบัติที่ผลักดันการคาดการณ์ไปสู่คลาส 1 (รายได้มากกว่า 50K)
- ค่า SHAP ติดลบ: คุณสมบัติที่ผลักดันการคาดการณ์ไปสู่คลาส 0 (รายได้น้อยกว่าหรือเท่ากับ 50K)
ผลรวมของค่าฐานและค่า SHAP ของคุณลักษณะทั้งหมดเท่ากับความน่าจะเป็นที่คาดการณ์ไว้ของแบบจําลองสําหรับการสังเกตนั้น
แก้ไข ปัญหา
| ประเด็น | สาเหตุ | การแก้ปัญหา |
|---|---|---|
OutOfMemoryError ระหว่าง TabularSHAP |
numSamples มีขนาดใหญ่เกินไปสําหรับหน่วยความจําที่พร้อมใช้งาน |
ลด numSamplesตัวอย่างเช่น เป็น 1,000 หรือเพิ่มหน่วยความจําตัวดําเนินการ Spark |
| การแปลง SHAP ช้า | สูง numSamples พร้อมคุณสมบัติมากมายช่วยเพิ่มเวลาในการประมวลผล |
ลดเหลือ numSamples 1,000-2,000 เพื่อผลลัพธ์การสํารวจที่เร็วขึ้น เพิ่มขึ้นสําหรับการวิเคราะห์ขั้นสุดท้าย |
FileNotFoundException สําหรับปาร์เก้ |
การเข้าถึงเครือข่ายถูก mmlspark.blob.core.windows.net บล็อก |
ตรวจสอบว่าพื้นที่ทํางาน Fabric ของคุณมีการเข้าถึงอินเทอร์เน็ตขาออก หรืออัปโหลดชุดข้อมูลไปยังเลคเฮาส์ของคุณ |
shapValues คอลัมน์ประกอบด้วย null |
การสังเกตบางอย่างอาจล้มเหลวหากค่าคุณลักษณะอยู่นอกการแจกแจงการฝึกอบรม | ตรวจสอบค่า Null หรือค่าที่ไม่คาดคิดในคุณสมบัติอินพุต กรองค่า Null จากผลลัพธ์ |
display() ไม่แสดงเอาต์พุต |
โค้ดกําลังทํางานนอกสภาพแวดล้อมสมุดบันทึก Fabric | ใช้ shaps_local.head() หรือ print(shaps_local) ในสภาพแวดล้อม Python มาตรฐาน |
เก็บกวาด
หากคุณอัปโหลดชุดข้อมูลไปยังเลคเฮาส์สําหรับบทช่วยสอนนี้ ให้ลบไปยังที่เก็บข้อมูลว่าง:
# Remove cached DataFrames from memory
training.unpersist()
explain_instances.unpersist()
print("Cached DataFrames released")