หมายเหตุ
การเข้าถึงหน้านี้ต้องได้รับการอนุญาต คุณสามารถลอง ลงชื่อเข้าใช้หรือเปลี่ยนไดเรกทอรีได้
การเข้าถึงหน้านี้ต้องได้รับการอนุญาต คุณสามารถลองเปลี่ยนไดเรกทอรีได้
At a glance
Goal: View requests in Chrome DevTools
Time: 5 minutes
Plugins: DevToolsPlugin
Prerequisites: Set up Dev Proxy
By default, Dev Proxy displays its messages in the command prompt. If you use Dev Proxy with an application that issues many requests, it's difficult to find the messages you're interested in. What's more, you might want to inspect the requests and responses intercepted by Dev Proxy.
To make it easier to find the messages you're interested in, use the DevToolsPlugin plugin to display Dev Proxy messages in Chrome DevTools.
Tip
Dev Proxy supports using Chrome DevTools with Microsoft Edge, Microsoft Edge Dev and Google Chrome.
The DevToolsPlugin exposes Dev Proxy messages, and information about intercepted requests and responses in Chrome DevTools.
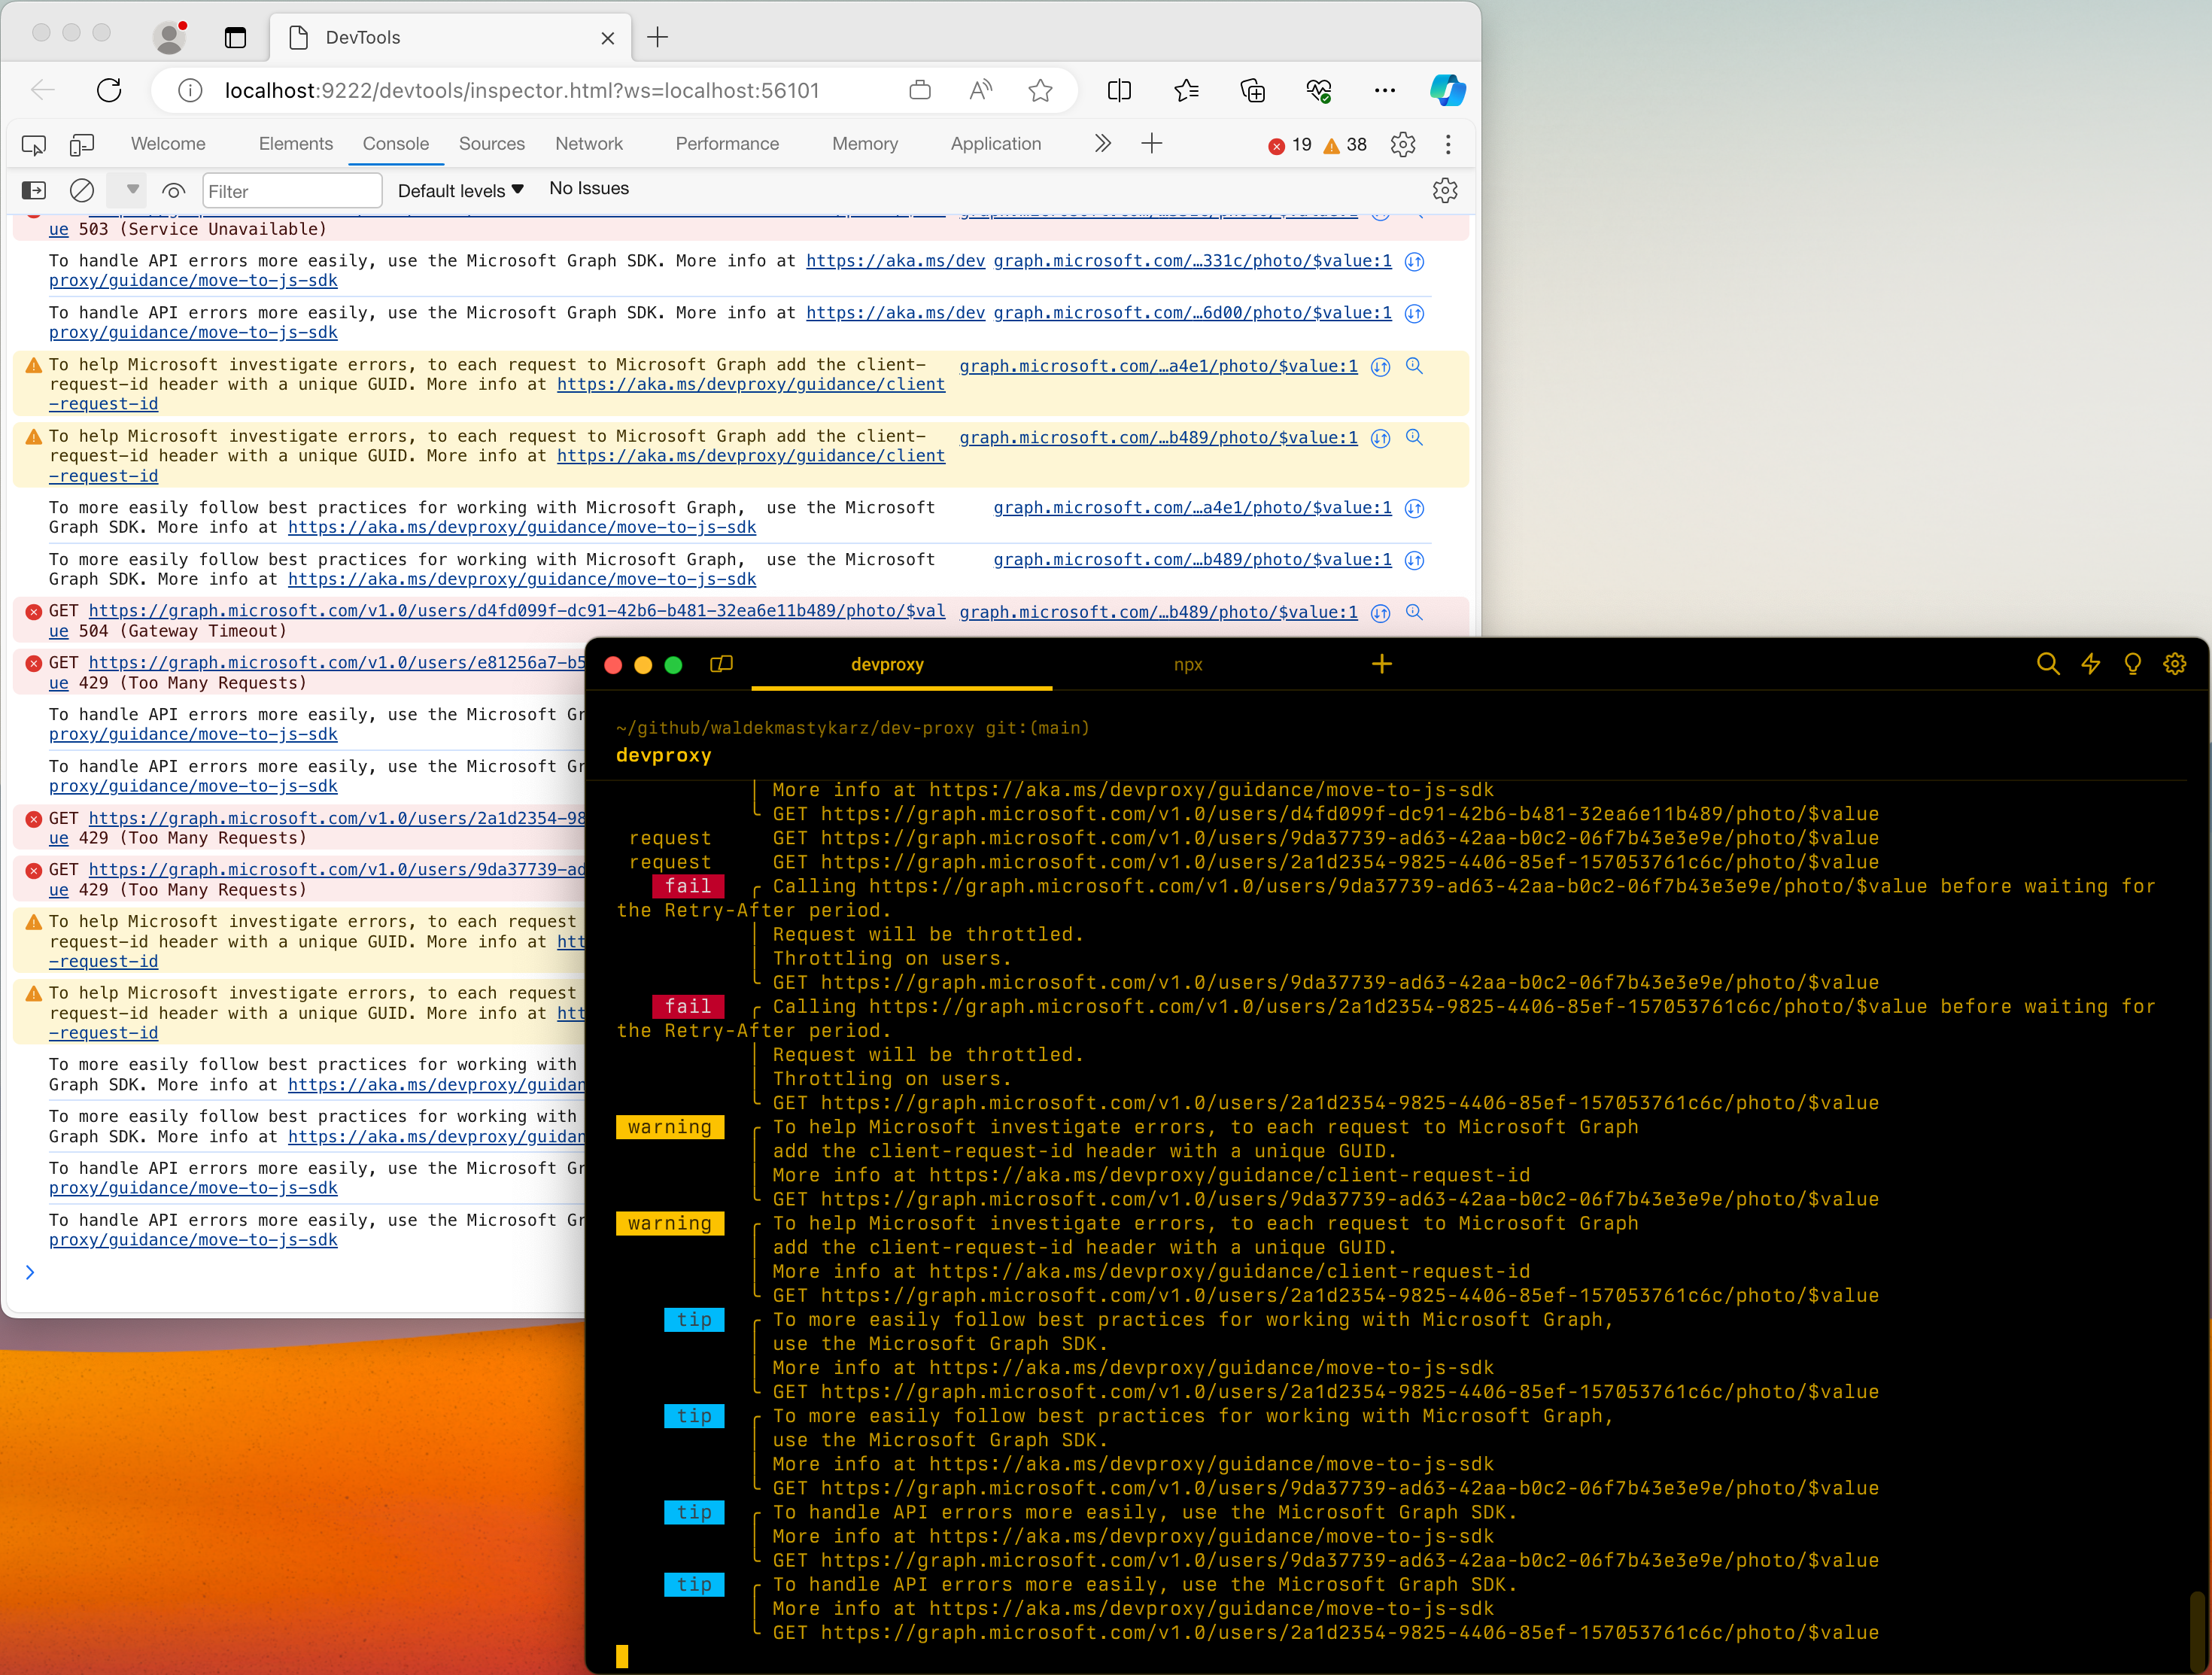
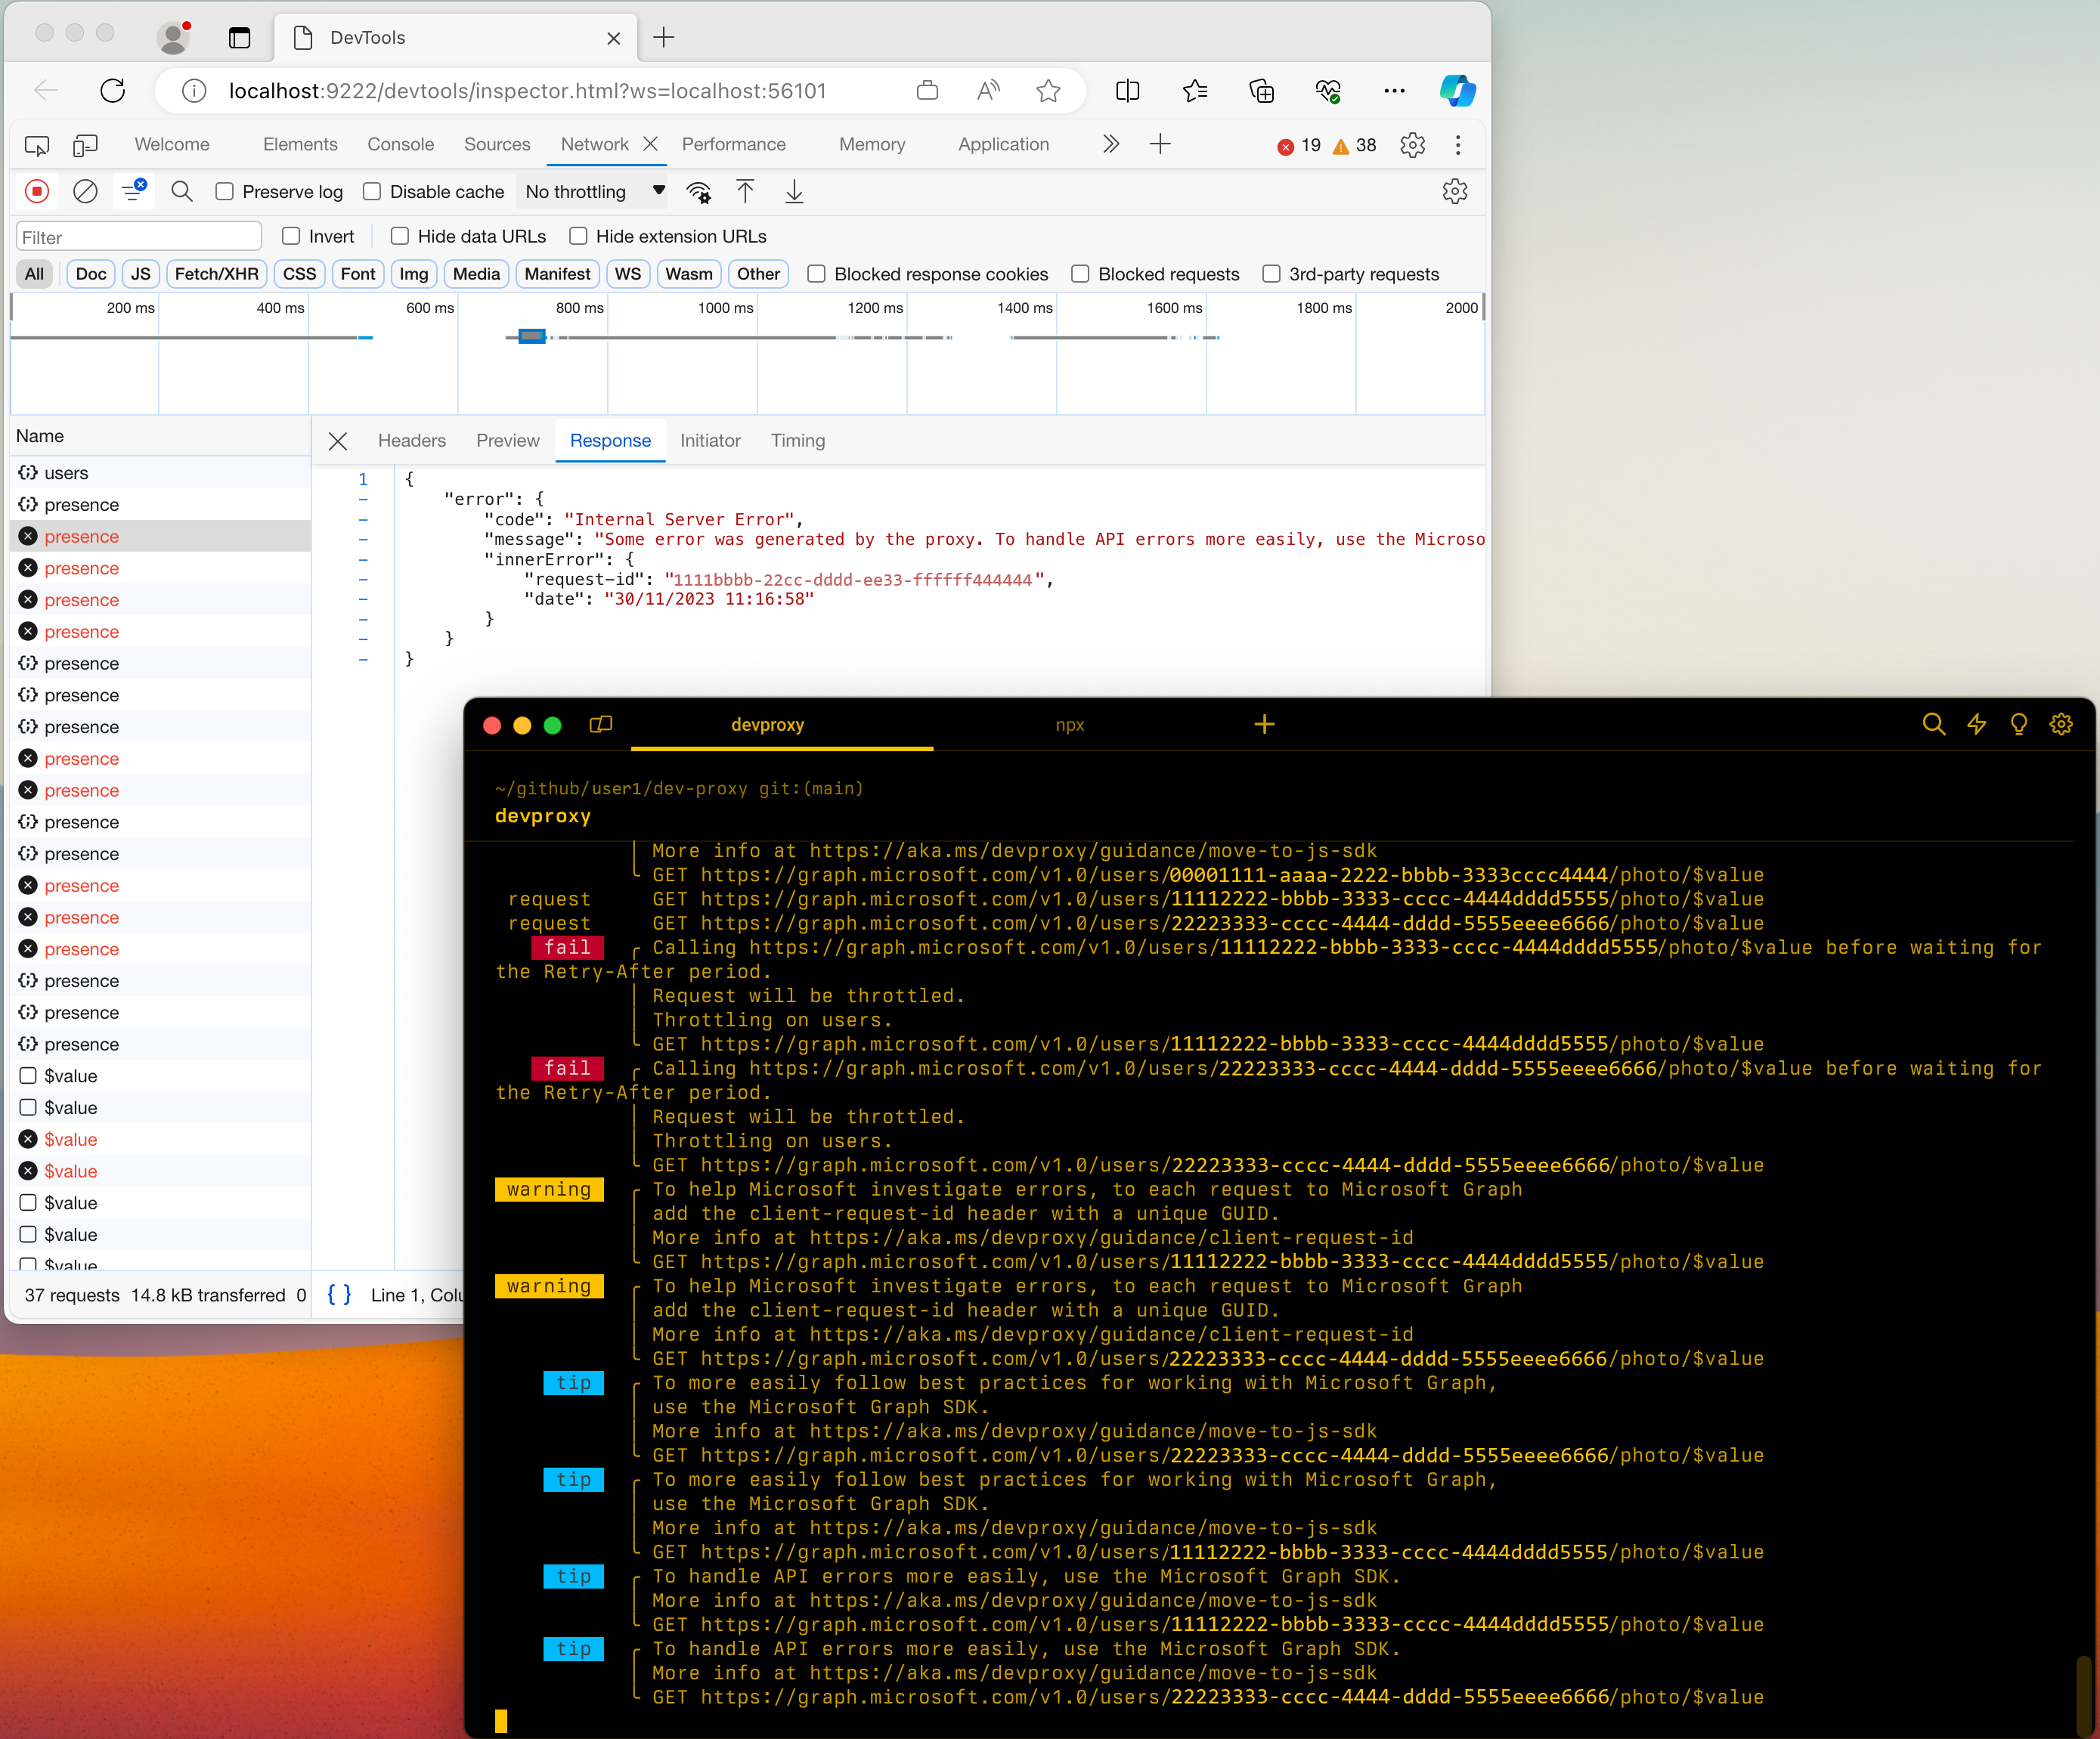
To use Chrome DevTools with Dev Proxy:
Open the devproxyrc.json file stored in your Dev Proxy installation directory. You can also use the
devproxy config opencommand.Enable the
DevToolsPluginplugin and add thedevToolsconfiguration section. SupportedpreferredBrowservalues are:Edge,EdgeDev,Chrome.The complete
devproxyrc.jsonfile looks like:File: devproxyrc.json
{
  "$schema": "https://raw.githubusercontent.com/dotnet/dev-proxy/main/schemas/v4.0.0/rc.schema.json",
  "plugins": [
    {
      "name": "DevToolsPlugin",
      "enabled": true,
      "pluginPath": "~appFolder/plugins/DevProxy.Plugins.dll",
      "configSection": "devTools"
    }
  ],
  "devTools": {
    "$schema": "https://raw.githubusercontent.com/dotnet/dev-proxy/main/schemas/v4.0.0/devtoolsplugin.schema.json",
    "preferredBrowser": "Edge"
  }
}
Save the
devproxyrc.jsonfile and start Dev Proxy.
Inspect requests when Dev Proxy runs in a container
When you run Dev Proxy in a container, a dev container, or GitHub Codespaces, the plugin can't launch a browser on your machine. Instead, configure the plugin to listen on a fixed port and to log the Dev Tools URL, and open the URL in the browser on your machine.
In the
devToolsconfiguration section, setportto a fixed port andlaunchBrowsertofalse:File: devproxyrc.json
{
  "$schema": "https://raw.githubusercontent.com/dotnet/dev-proxy/main/schemas/v4.0.0/rc.schema.json",
  "plugins": [
    {
      "name": "DevToolsPlugin",
      "enabled": true,
      "pluginPath": "~appFolder/plugins/DevProxy.Plugins.dll",
      "configSection": "devTools"
    }
  ],
  "devTools": {
    "$schema": "https://raw.githubusercontent.com/dotnet/dev-proxy/main/schemas/v4.0.0/devtoolsplugin.schema.json",
    "port": 19229,
    "launchBrowser": false
  }
}
Publish or forward the port to the same port on your machine. The Dev Tools URL contains the port number, so the port on your machine must match the port in the configuration.
If you use the Dev Proxy Docker image, publish the port when you start the container:
docker run --rm -it -p 8000:8000 -p 8897:8897 -p 19229:19229 -v ${PWD}:/config ghcr.io/dotnet/dev-proxy:latestThe Docker image starts Dev Proxy with
--ip-address 0.0.0.0, so the plugin listens on all interfaces. If you run Dev Proxy in your own container and publish the port, start Dev Proxy with--ip-address 0.0.0.0too.If you use Dev Proxy with Aspire, publish the port on the Dev Proxy container resource:
var devProxy = builder.AddDevProxyContainer("devproxy")
    .WithConfigFile("./devproxy.json")
    .WithCertFolder(".devproxy/cert")
    .WithConfigFolder(".devproxy/config")
    // publish the DevToolsPlugin port to the same port on the host
    .WithHttpEndpoint(port: 19229, targetPort: 19229, name: "devtools");
If you use a dev container or GitHub Codespaces in Visual Studio Code, forward the port to your machine.
Start Dev Proxy. Dev Proxy logs the Dev Tools URL, for example:
DevToolsPlugin available at devtools://devtools/bundled/inspector.html?ws=127.0.0.1:19229/<token>. Open this URL in Microsoft Edge or Google Chrome to inspect requests.Copy the URL and open it in Microsoft Edge or Google Chrome on your machine.
Note
Dev Proxy generates a new token each time it starts. After you restart Dev Proxy, copy the new URL from the log.
See also
ทํางานร่วมกับเราใน GitHub
แหล่งที่มาสำหรับเนื้อหานี้สามารถพบได้บน GitHub ซึ่งคุณยังสามารถสร้างและตรวจสอบปัญหาและคำขอดึงข้อมูลได้ สำหรับข้อมูลเพิ่มเติม ให้ดูคู่มือผู้สนับสนุนของเรา

Dev Proxy