หมายเหตุ
การเข้าถึงหน้านี้ต้องได้รับการอนุญาต คุณสามารถลอง ลงชื่อเข้าใช้หรือเปลี่ยนไดเรกทอรีได้
การเข้าถึงหน้านี้ต้องได้รับการอนุญาต คุณสามารถลองเปลี่ยนไดเรกทอรีได้
The SharePoint Framework v1.19 introduces a new Data Visualization Template that can be used to implement charts. This tutorial provides step-by-step guidance on implementing Data Visualization with Adaptive Card Extensions (ACEs).
Note
Before you start, complete the procedures in the following articles to ensure that you understand the basic flow of creating a custom Adaptive Card Extension: Build your first SharePoint Adaptive Card Extension
Important
Line chart data visualization type was released as part of the SPFx 1.19 release. Other data visualization types, such as the bar chart, donut chart, and pie charts, were introduced in the SPFx 1.20 release.
Scaffold an Adaptive Card Extension project
Create a new project directory for your project and change your current folder to that directory.
Create a new project by running the Yeoman SharePoint Generator from within the new directory you created:
yo @microsoft/sharepoint
When prompted, enter the following values (select the default option for all other prompts):
- What is your solution name? dataVisualization-tutorial
- Which type of client-side component to create? Adaptive Card Extension
- Which template do you want to use? Data Visualization Card Template
- What is your Adaptive Card Extension name? DataVisualization
At this point, Yeoman installs the required dependencies and scaffolds the solution files. This process might take few minutes.
Start the project's development server (heft start for SPFx 1.22 and later; use the Gulp toolchain for earlier projects). Open a test SharePoint page and load local manifests using the SPFx developer toolbar. Edit the page and open the toolbox to find the Data Visualization card. The screenshots show the original sample's development UI:
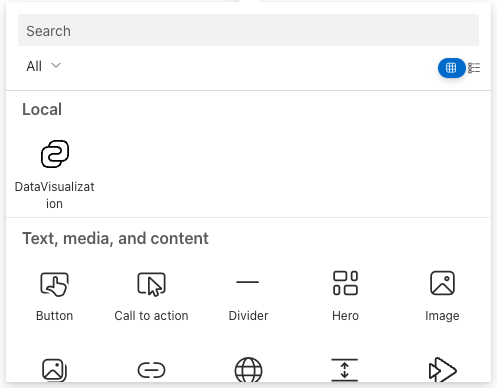
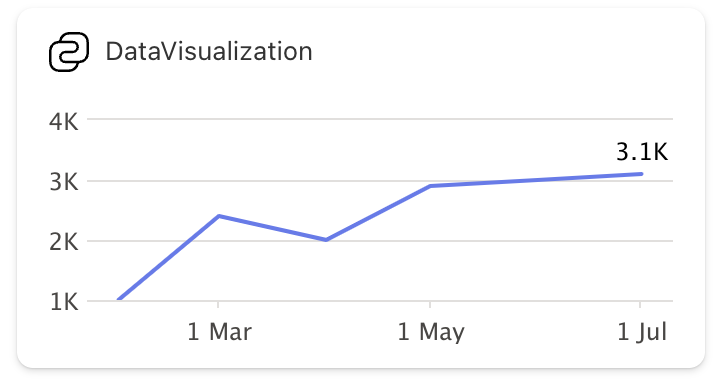
Select DataVisualization to add it to the page. Save the page and leave edit mode. The default rendering displays the line chart using mock data:
Explore the scaffolded code
Explore the Card View
Locate and open the following file: ./src/adaptiveCardExtensions/dataVisualization/cardView/CardView.ts. The Card View implements the BaseComponentsCardView base class cardViewParameters getter to specify the card configuration:
const seriesData : IDataPoint<Date>[] = [
  ... // omitted for brevity
];

export class CardView extends BaseComponentsCardView<..> {
  public get cardViewParameters(): IDataVisualizationCardViewParameters {
    return LineChartCardView({
      cardBar: {
        componentName: 'cardBar',
        title: this.properties.title
      },
      body: {
        componentName: 'dataVisualization',
        dataVisualizationKind: 'line',
        series: [{
          data: seriesData,
          lastDataPointLabel: '3.1K'
        }]
      }
    });
  }
}
Notice how the body section of the Card View specifies the dataVisualization component.
Explore possible layouts
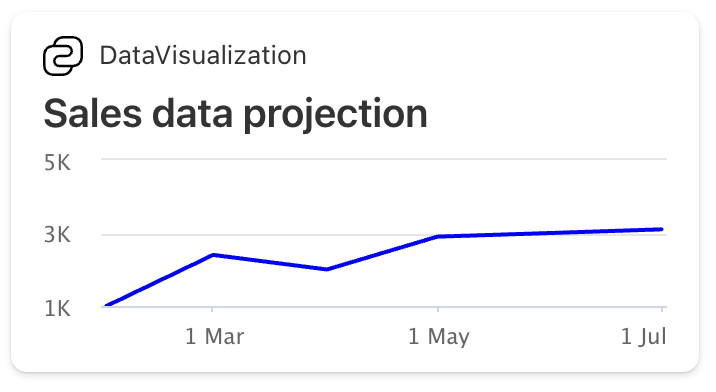
Based on the configuration in Card View, a chart can be rendered in two layouts:
Regular
Adding zero or one component along with a dataVisualization component in the body:
Right side
Adding more than one component in the Card View along with dataVisualization component in the body renders the chart on the right side of the card. For example: Header and Footer along with dataVisualization component in body.
Locate & replace the cardViewParameters() getter with the following code to add a header and footer to the card:
public get cardViewParameters(): IDataVisualizationCardViewParameters {
  return LineChartCardView({
    cardBar: {
      componentName: 'cardBar',
      title: this.properties.title
    },
    header: {
      componentName: 'text',
      text: 'Sales Projection'
    },
    body: {
      componentName: 'dataVisualization',
      dataVisualizationKind: 'line',
      series: [{
          data: seriesData,
          lastDataPointLabel: '3.1K'
      }]
    },
    footer: {
      componentName: 'cardButton',
      title: 'View Details',
      action: {
        type: 'QuickView',
        parameters: {
          view: QUICK_VIEW_REGISTRY_ID
        }
      }
    }
  });
}

Explore the Quick Views
The ACE class is located in the following file: ./src/adaptiveCardExtensions/dataVisualization/quickView/QuickView.ts and mostly has the same code as Generic Card View.
Explore the ACE class
The ACE class is located in the following file: ./src/adaptiveCardExtensions/dataVisualization/dataVisualizationAdaptiveCardExtension.ts and mostly has the same code as Generic Card View.
Support for multiple data series in the chart
The ACE dataVisualization component supports multiple series lines in the chart. To add multiple lines to the chart, add other entries to the body.series array on the LineChartCardView object in the Card View.
For example, consider the following data series:
// Sample Data
const seriesData : IDataPoint<Date>[] = [
  { x: new Date(2024, 1, 1), y: 1000 },
  { x: new Date(2024, 2, 1), y: 2400 },
  { x: new Date(2024, 3, 1), y: 2000 },
  { x: new Date(2024, 4, 1), y: 2900 },
  { x: new Date(2024, 5, 1), y: 3000 },
  { x: new Date(2024, 6, 1), y: 3100 }
];

const seriesData2 : IDataPoint<Date>[] = [
  { x: new Date(2024, 1, 1), y: 600 },
  { x: new Date(2024, 2, 1), y: 1200 },
  { x: new Date(2024, 3, 1), y: 3200 },
  { x: new Date(2024, 4, 1), y: 2800 },
  { x: new Date(2024, 5, 1), y: 3600 },
  { x: new Date(2024, 6, 1), y: 4500 }
];

const seriesData3 : IDataPoint<Date>[] = [
  { x: new Date(2024, 1, 1), y: 5200 },
  { x: new Date(2024, 2, 1), y: 1000 },
  { x: new Date(2024, 3, 1), y: 1800 },
  { x: new Date(2024, 4, 1), y: 2900 },
  { x: new Date(2024, 5, 1), y: 600 },
  { x: new Date(2024, 6, 1), y: 400 }
];
Add all three series to the data visualization Card View and optionally set the color of specific series:
export class CardView extends BaseComponentsCardView<
  IRecentSalesAdaptiveCardExtensionProps,
  IRecentSalesAdaptiveCardExtensionState,
  IDataVisualizationCardViewParameters
> {
  public get cardViewParameters(): IDataVisualizationCardViewParameters {
    return LineChartCardView({
      cardBar: {
        componentName: 'cardBar',
        title: this.properties.title
      },
      body: {
        componentName: 'dataVisualization',
        dataVisualizationKind: 'line',
        series: [{
          data: seriesData,
          lastDataPointLabel: '3.1K'
        },
        {
          data: seriesData2,
          lastDataPointLabel: '4.5K',
          color: '#800080'
        },
        {
          data: seriesData3,
          lastDataPointLabel: '0.4K',
          color: '#01CBAE'
        }]
      }
    });
  }

  public get onCardSelection(): IQuickViewCardAction | IExternalLinkCardAction | undefined {
    return {
      type: 'QuickView',
      parameters: { view: QUICK_VIEW_REGISTRY_ID }
    };
  }
}
This card when in the large mode generates the following rendering:

Support for more chart types
The SharePoint Framework v1.20 introduces support for newer chart types, enabling developers to create visually appealing data visualizations like bar, pie, and donut charts.

Bar Chart
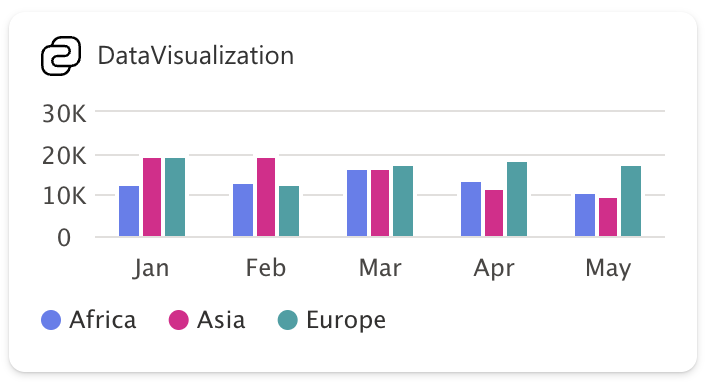
To render a vertically grouped bar chart, follow this example:
// Sample Data
const seriesData: IDataPoint<string>[] = [
  { x: "Jan", y: 12986 },
  { x: "Feb", y: 13424 },
  { x: "Mar", y: 17118 },
  { x: "Apr", y: 14017 },
  { x: "May", y: 11245 }
];

const seriesData2: IDataPoint<string>[] = [
  { x: "Jan", y: 19631},
  { x: "Feb", y: 19905},
  { x: "Mar", y: 17098},
  { x: "Apr", y: 11918},
  { x: "May", y: 10357}
];

const seriesData3: IDataPoint<string>[] = [
  { x: "Jan", y: 19762},
  { x: "Feb", y: 12926},
  { x: "Mar", y: 17670},
  { x: "Apr", y: 19055},
  { x: "May", y: 18142}
];
Add all three series to the data visualization Card View and optionally set the name or color of the individual series:
export class CardView extends BaseComponentsCardView<
  IDataVisualizationAdaptiveCardExtensionProps,
  IDataVisualizationAdaptiveCardExtensionState,
  IDataVisualizationCardViewParameters
> {
  public get cardViewParameters(): IDataVisualizationCardViewParameters {
    return BarChartCardView({
      cardBar: {
        componentName: 'cardBar',
        title: this.properties.title
      },
      body: {
        componentName: 'dataVisualization',
        dataVisualizationKind: 'bar',
        series: [{
            data: seriesData,
            name: 'Africa'
        }, {
            data: seriesData2,
            name: 'Asia'
        }, {
            data: seriesData3,
            name: 'Europe'
        }]
      }
    });
  }
}
The rendered bar chart looks something like this:
Pie/Donut Charts
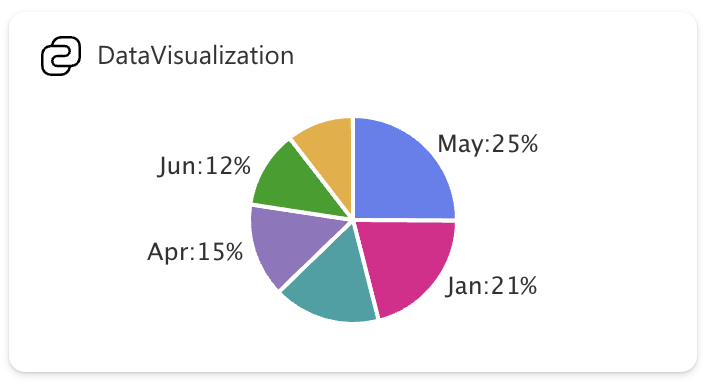
Here's an example of the CardView.ts file that renders a pie chart with the given data:
import {
  BaseComponentsCardView,
  IDataVisualizationCardViewParameters,
  PieChartCardView,
  IPieDataPoint,
} from '@microsoft/sp-adaptive-card-extension-base';
import {
  IDataVisualizationAdaptiveCardExtensionProps,
  IDataVisualizationAdaptiveCardExtensionState,
} from '../DataVisualizationAdaptiveCardExtension';

// Sample Data
const seriesData: IPieDataPoint[] = [
  { x: 'January', y: 50 },
  { x: 'February', y: 25, color: '#eaae32', showLabel: false },
  { x: 'March', y: 40, showLabel: false },
  { x: 'Apr', y: 35 },
  { x: 'May', y: 60 },
  { x: 'Jun', y: 29 }
];

export class CardView extends BaseComponentsCardView<
  IDataVisualizationAdaptiveCardExtensionProps,
  IDataVisualizationAdaptiveCardExtensionState,
  IDataVisualizationCardViewParameters
> {
  public get cardViewParameters(): IDataVisualizationCardViewParameters {
    return PieChartCardView({
      cardBar: {
        componentName: 'cardBar',
        title: this.properties.title
      },
      body: {
        componentName: 'dataVisualization',
        dataVisualizationKind: 'pie',
        isDonut: false,
        series: [{
            data: seriesData,
        }]
      }
    });
  }
}
Notice how dataVisualizationKind is set to pie and PieChartCardView is returned with the required parameters. Refresh the test page with local manifests enabled to see the pie chart:
The isDonut flag indicates if the pie chart should be rendered as a donut chart, which is false by default. When set to true, the donut chart is rendered as follows:
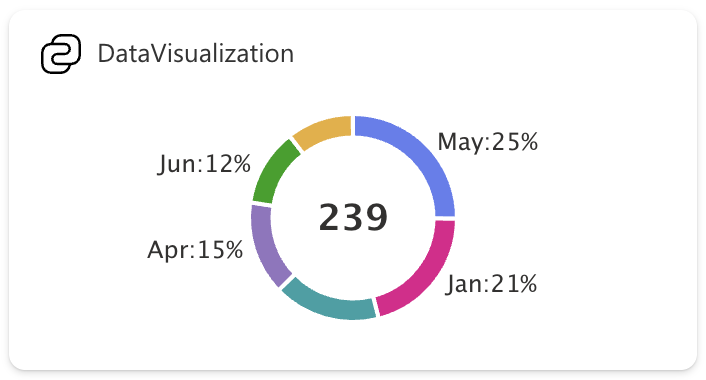
The numeric text in the center displays the sum of all the y values in the series.