Merk
Tilgang til denne siden krever autorisasjon. Du kan prøve å logge på eller endre kataloger.
Tilgang til denne siden krever autorisasjon. Du kan prøve å endre kataloger.
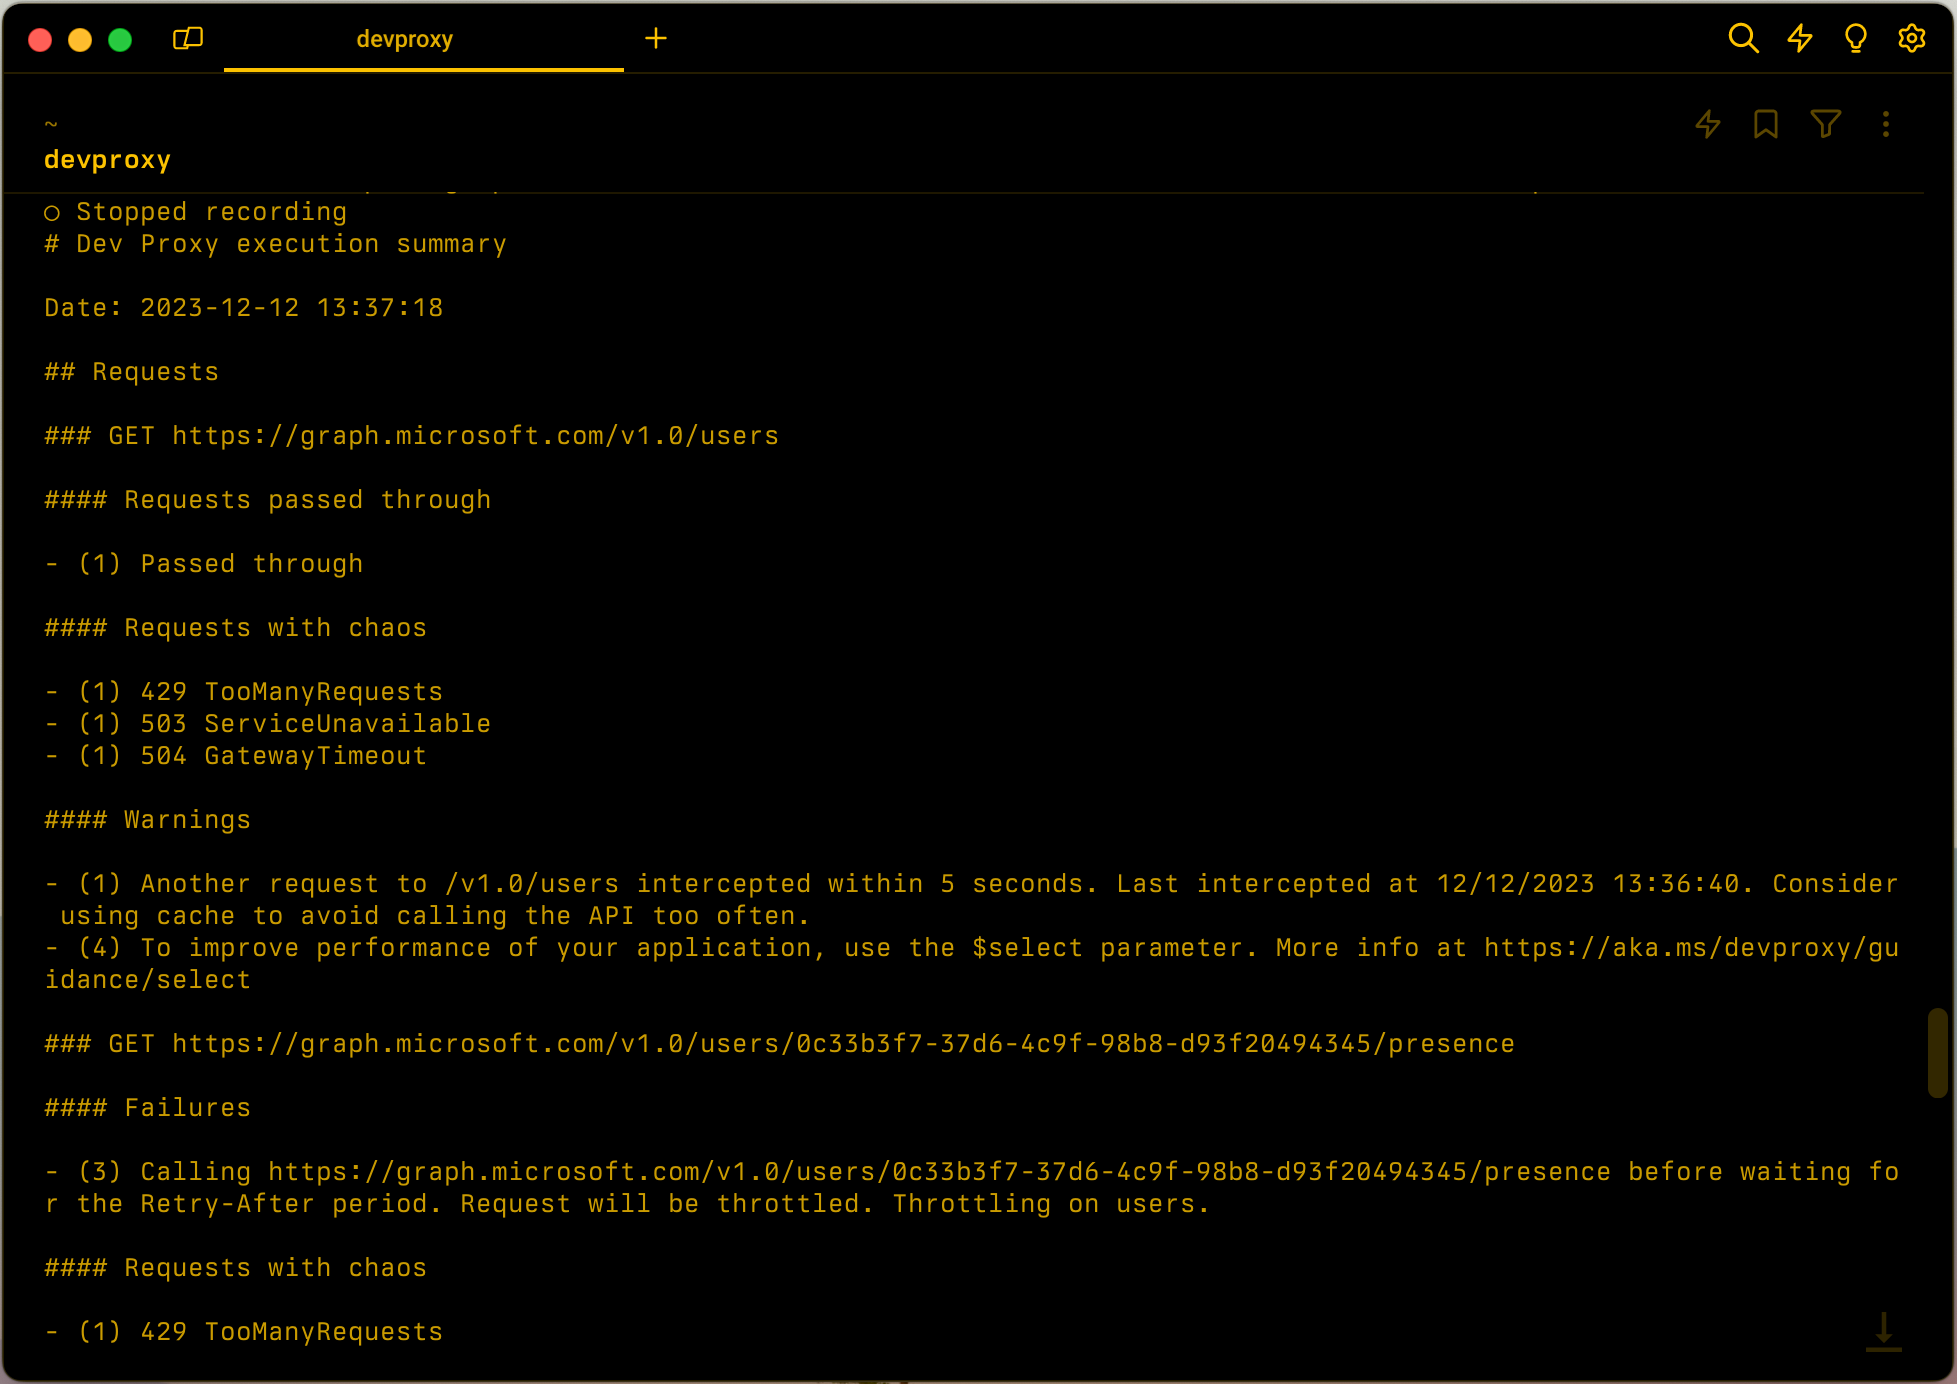
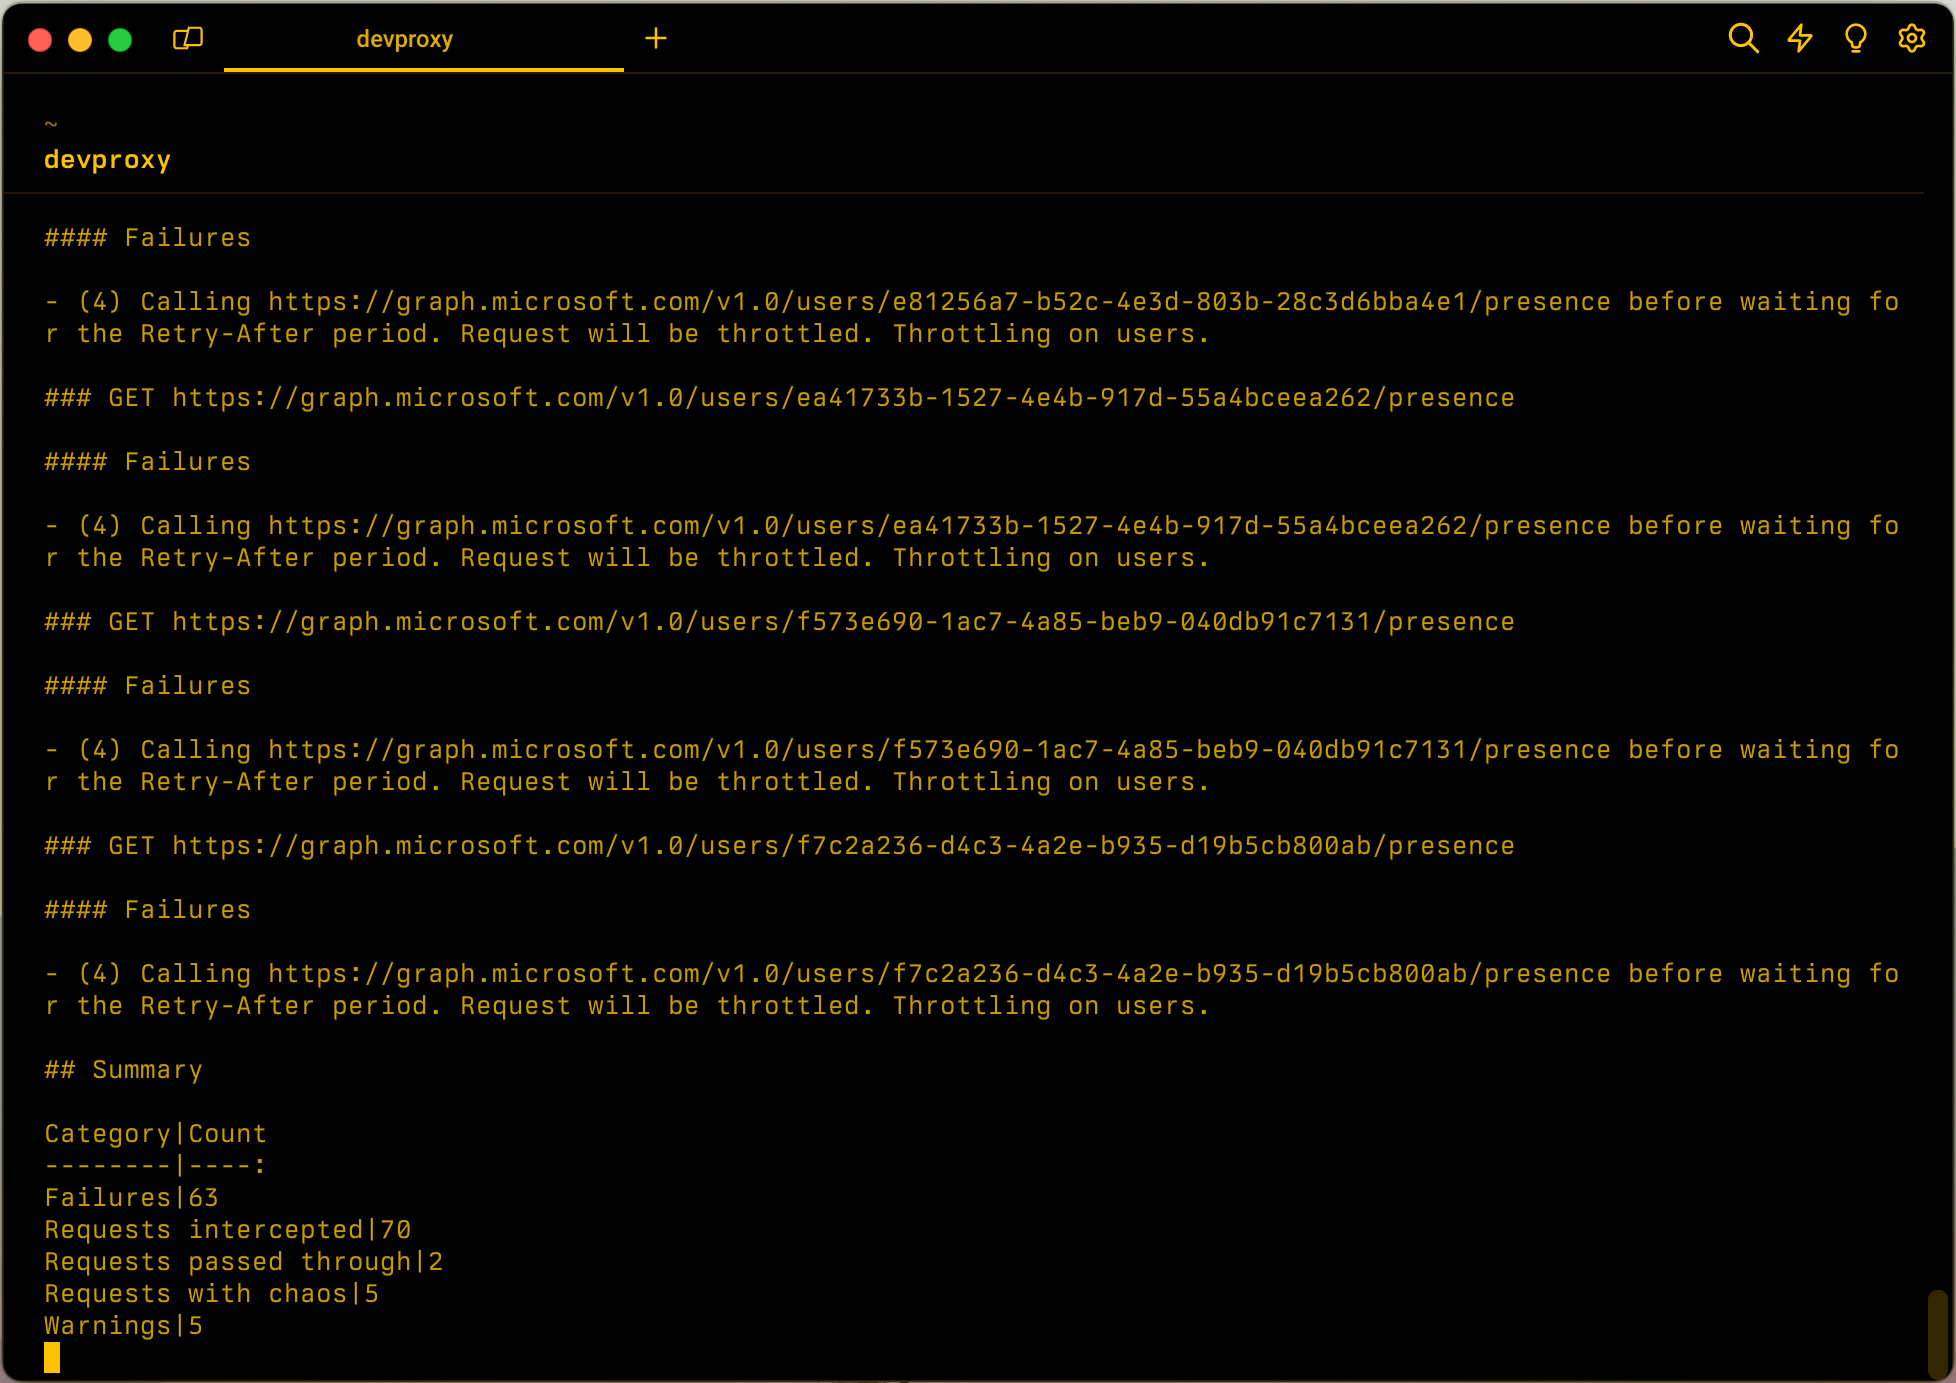
Creates a summary of the requests that pass through the proxy.
Tip
Use a reporter plugin in your configuration to save the summary to a file.
Configuration example
{
  "$schema": "https://raw.githubusercontent.com/dotnet/dev-proxy/main/schemas/v4.0.0/rc.schema.json",
  "plugins": [
    {
      "name": "ExecutionSummaryPlugin",
      "enabled": true,
      "pluginPath": "~appFolder/plugins/DevProxy.Plugins.dll",
      "configSection": "executionSummaryPlugin"
    }
  ],
  "executionSummaryPlugin": {
    "$schema": "https://raw.githubusercontent.com/dotnet/dev-proxy/main/schemas/v4.0.0/executionsummaryplugin.schema.json",
    "groupBy": "url"
  }
}
Configuration properties
| Property | Description | Default |
|---|---|---|
groupBy |
How proxy should group the information in the summary. Available options: url, messageType |
url |
Command line options
| Name | Description | Default |
|---|---|---|
--summary-group-by |
How proxy should group the information in the summary. Available options: url, messageType |
url |
Output
ExecutionSummaryPlugin creates its report when you stop recording. To save the report as JSON, add the JsonReporter after ExecutionSummaryPlugin in your configuration. JsonReporter writes the report to a file named ExecutionSummaryPlugin_JsonReporter.json in the current working directory. If the file already exists, Dev Proxy appends a timestamp to the file name, for example ExecutionSummaryPlugin_JsonReporter_20261105104151.json.
The JSON report is an object nested three levels deep. The values at the innermost level are numbers that show how many times Dev Proxy logged a message. The meaning of each level depends on the groupBy setting.
Dev Proxy uses the following readable category names in the report:
| Category | Description |
|---|---|
Requests intercepted |
Requests that Dev Proxy intercepted. Only included when groupBy is messageType |
Requests passed through |
Requests that Dev Proxy passed through to the original server |
Requests mocked |
Requests for which a plugin returned a mock response |
Requests with chaos |
Requests for which a plugin simulated an error or latency |
Failures |
Requests that failed |
Tips |
Tips that plugins logged for the request |
Warnings |
Warnings that plugins logged for the request |
Unknown |
Other messages logged for the request, such as request timestamps and messages from plugins that skipped the request |
Group by URL
When groupBy is url, the report has the following shape:
{
  "<method> <url>": {
    "<category>": {
      "<message>": <count>
    }
  }
}
| Level | Description |
|---|---|
| 1 | The HTTP method and URL of each intercepted request, for example GET https://jsonplaceholder.typicode.com/users. Each method and URL combination appears once, no matter how many times your app called it |
| 2 | The category of the messages that Dev Proxy logged for the request |
| 3 | The message that Dev Proxy logged, mapped to the number of times Dev Proxy logged it for the method and URL |
The following example shows a report for an app that called GET https://jsonplaceholder.typicode.com/users once, which Dev Proxy mocked, and GET https://jsonplaceholder.typicode.com/posts twice, which Dev Proxy passed through. The Unknown entries are shortened for readability.
{
  "GET https://jsonplaceholder.typicode.com/users": {
    "Unknown": {
      "2026-11-05T10:41:13.1151430+00:00": 1,
      "GET https://jsonplaceholder.typicode.com/users": 1
    },
    "Requests mocked": {
      "200 https://jsonplaceholder.typicode.com/users": 1
    }
  },
  "GET https://jsonplaceholder.typicode.com/posts": {
    "Unknown": {
      "No matching mock response found": 2,
      "GET https://jsonplaceholder.typicode.com/posts": 2
    },
    "Requests passed through": {
      "Passed through": 2
    }
  }
}
Group by message type
When groupBy is messageType, the report has the following shape:
{
  "<category>": {
    "<message>": {
      "<method> <url>": <count>
    }
  }
}
| Level | Description |
|---|---|
| 1 | The category of the messages that Dev Proxy logged |
| 2 | The message that Dev Proxy logged. For the Requests intercepted and Requests passed through categories, this level repeats the category name |
| 3 | The HTTP method and URL of the request, mapped to the number of times Dev Proxy logged the message for that method and URL |
The following example shows the report for the same requests grouped by message type. The Unknown category is shortened for readability.
{
  "Requests intercepted": {
    "Requests intercepted": {
      "GET https://jsonplaceholder.typicode.com/users": 1,
      "GET https://jsonplaceholder.typicode.com/posts": 2
    }
  },
  "Unknown": {
    "No matching mock response found": {
      "GET https://jsonplaceholder.typicode.com/posts": 2
    }
  },
  "Requests mocked": {
    "200 https://jsonplaceholder.typicode.com/users": {
      "GET https://jsonplaceholder.typicode.com/users": 1
    }
  },
  "Requests passed through": {
    "Requests passed through": {
      "GET https://jsonplaceholder.typicode.com/posts": 2
    }
  }
}
Tip
To check in a CI pipeline which requests Dev Proxy intercepted, use the messageType grouping and read the keys of the ["Requests intercepted"]["Requests intercepted"] object. With the url grouping, read the top-level keys. Each key starts with the HTTP method followed by a space and the URL. Don't rely on the contents of the Unknown category, because it includes timestamps and other diagnostic messages.
See also
Next step
Samarbeid med oss på GitHub
Du finner kilden for dette innholdet på GitHub. Der du også kan opprette og se gjennom problemer og pull-forespørsler. Hvis du vil ha mer informasjon, kan du se vår bidragsyterveiledning.
